Published on
September 22, 2026


If you use one CAC number for everything, you can make bad budget calls. Blended CAC tells me what customer acquisition costs across the whole company. Incremental CAC tells me what the next customer costs after extra spend.
Here’s the short version:
This comes down to one simple rule: I use blended CAC to report performance, and incremental CAC to decide where the next dollar goes.
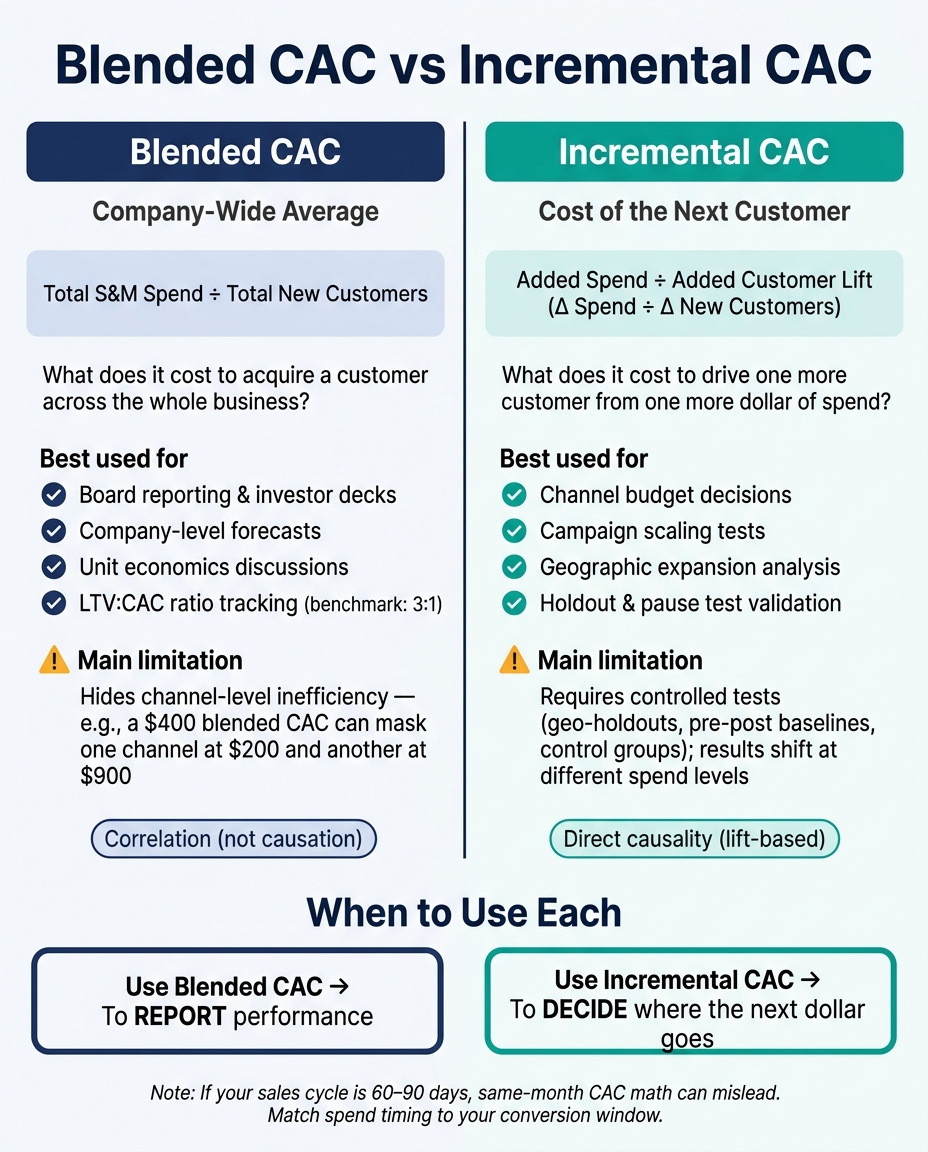
Blended CAC vs Incremental CAC: Key Differences at a Glance
| Metric | What it tells me | Formula | Best use | Main risk |
|---|---|---|---|---|
| Blended CAC | Average acquisition cost across the business | Total S&M spend ÷ total new customers | Reporting, planning, board updates | Hides channel gaps |
| Incremental CAC | Cost of extra customers from extra spend | Added spend ÷ added customer lift | Budget shifts, channel tests, scaling | Harder to measure well |
If I want the big picture, I look at blended CAC. If I want to know whether a budget increase is worth it, I look at incremental CAC. That’s the difference that matters.
Blended CAC = Total Sales & Marketing Costs ÷ Total New Customers Acquired
This metric rolls up your company’s acquisition spend into one average number. Include ad spend, sales and marketing payroll, software, agency fees, creative production, and allocated overhead. Leave out fulfillment, support, product development, retention spend, leads, trials, and upsells.
Blended CAC is a board-ready metric for company-level reporting. When you pair it with LTV, it helps show whether growth can hold up over time. A common target is a 3:1 LTV-to-CAC ratio [2].
It also gives you a steady baseline for company-wide acquisition efficiency. That’s the key point: blended CAC is the reporting baseline, not the spending rule.
The main limit is causality. If blended CAC goes down, that doesn’t automatically mean your paid spend got better. It may reflect organic demand, referrals, brand momentum, or a different customer mix [2].
Because blended CAC averages everything together, it works well for reporting but falls short for channel optimization. If you want to know what spend is driving the next customer, use incremental CAC. That marginal effect is what incremental CAC measures.
Incremental CAC = Incremental Channel or Campaign Spend ÷ Incremental Customers (Lift)
Incremental CAC shows the cost of customers created by an added spend increase, not customers who would have converted on their own.
That distinction matters more than it may seem at first. If a campaign gets credit for conversions that were going to happen anyway, your CAC can look better than it is. Incremental CAC tries to strip that out and focus on lift - the customers caused by the extra spend.
That’s why attribution alone isn’t enough. Platform-reported conversions can overstate lift because some of that demand already existed. To get a usable number, you need a causal test, not just platform reporting. In practice, that usually means a geo-holdout, a pre-post baseline, or a control group.
Six inputs are non-negotiable if you want a result you can trust:
Miss one of these, and the number can get shaky fast. For example, if Paid Social and Search run at the same time without a rule for separation, both may claim the same customer lift. That makes the result muddy.
With those rules in place, the next step is to compare incremental CAC with blended CAC side by side.
Incremental CAC is built for next-dollar decisions.
It helps answer the questions blended CAC can’t answer well: Which channels should get more budget? Is this campaign worth scaling? Will a new geography bring in net-new customers, or just pick up demand that was already there?
For growth-stage teams and fractional CFOs, this is often where the metric earns its keep. It helps separate demand creation from demand capture, which is a big deal when every extra $1 needs to work hard.
The catch is simple: the same controls that make incremental CAC useful also make it harder to maintain.
Channel overlap can make clean testing tough. Results can also shift at different spend levels. A campaign that works at $10,000 per month may not perform the same way at $100,000 per month. That’s one of the biggest traps in planning.
So for planning, treat incremental CAC as a range, not a fixed number. It’s a directional tool, not a forever metric.
Next, compare incremental CAC and blended CAC side by side to see when each should guide planning, reporting, and channel decisions.
Put them next to each other and the difference gets clear fast. The table below shows where each metric fits.
| Metric | Core question | Formula | Customer denominator | Causality | Best used at | Best decision use | Main limitation |
|---|---|---|---|---|---|---|---|
| Blended CAC | Company-wide acquisition health | Total S&M costs ÷ all new customers | All new customers (organic + paid) | Correlation | Company-wide / board | Board reporting | Hides channel-level inefficiency |
| Incremental CAC | Cost of the next customer from added spend | Δ spend ÷ Δ new customers | Customers caused by incremental spend | Direct causality | Channel, campaign, or experiment | Budget changes, channel expansion | Requires controlled tests; harder to maintain |
The working rule is simple: use blended CAC to track the business, and use incremental CAC when you're deciding whether to add spend.
Blended CAC fits consolidated forecasts, board reporting, and unit economics discussions. It gives investors and executives a steady, company-level view of acquisition efficiency over time. Incremental CAC belongs in the room when the team is debating a budget increase, a channel expansion, or a campaign test. It answers a different question: will the next dollar bring in a new customer, or is the channel just taking credit for someone who was already on the way?
When the gap between the two gets sharp, start with measurement and channel mix - not the model. That kind of spread usually points to something worth checking. Two common causes are reactivation volume and inconsistent customer definitions across teams. Incrementality tests often show that a large share of branded-search conversions would have happened anyway [3].
A simple fix helps here. Finance teams, often supported by fractional CFO services, should keep a metric dictionary: one shared document that locks in definitions for “new customer,” cost inclusions, and measurement windows. Then pair that with weekly operating reviews and monthly or quarterly validation.
For growth-stage finance teams, the best question isn't which CAC is better. It's which decision each metric helps you make.
Blended CAC shows your company-wide cost to acquire customers. Incremental CAC shows what it costs to drive the next dollar of growth. That's a big difference.
CAC also doesn't mean much on its own. You need to look at it next to LTV, payback period, and return. Otherwise, you're staring at one number and hoping it tells the whole story. It won't.
Use this checklist:
Use blended CAC for performance reporting. Use incremental CAC to decide where the next dollar should go.
Use incremental CAC for day-to-day decisions. It’s the right lens when you’re adjusting campaigns, fine-tuning spend, or deciding how to split budget across acquisition channels.
Use blended CAC when you want the big-picture view. It works well for board reporting and benchmarking because it shows overall efficiency across the business.
The key difference is simple: incremental CAC looks at channel-level costs. That makes it easier to spot which channels are driving growth and which ones are putting pressure on unit economics.
Measure incremental CAC by isolating the actual impact of marketing instead of leaning on blended averages. The goal is simple: figure out which conversions happened because of paid spend, and which ones would have happened anyway.
A solid way to do that is with incrementality testing. For example, geo-holdout tests let you pause or reduce spend in certain regions and compare results against regions where campaigns keep running. That gives you a cleaner read on whether paid media drove those conversions or just took credit for demand that was already there.
Also, skip simple last-click attribution. It often gives too much credit to the final touchpoint and ignores the rest of the journey. Use multi-touch attribution instead so each channel gets credit based on its role in moving someone toward conversion.
And make sure CAC is fully loaded. That means including more than ad spend alone:
If those costs are left out, CAC can look better than it actually is.
Blended CAC can hide channel problems because it rolls all acquisition costs into one average. When that happens, lower-cost channels like organic can make higher-cost channels like paid look better than they are.
That’s the trap. Paid may seem cheaper on paper, even when its efficiency is slipping. And that can delay the moment you spot weak paid performance or slower customer payback.
A better approach is to break the numbers apart. Compare paid vs. organic. Then split paid CAC by channel so you can see where costs are climbing and where performance is holding up. Once you do that, the weak spots show up much sooner.