Published on
September 22, 2026

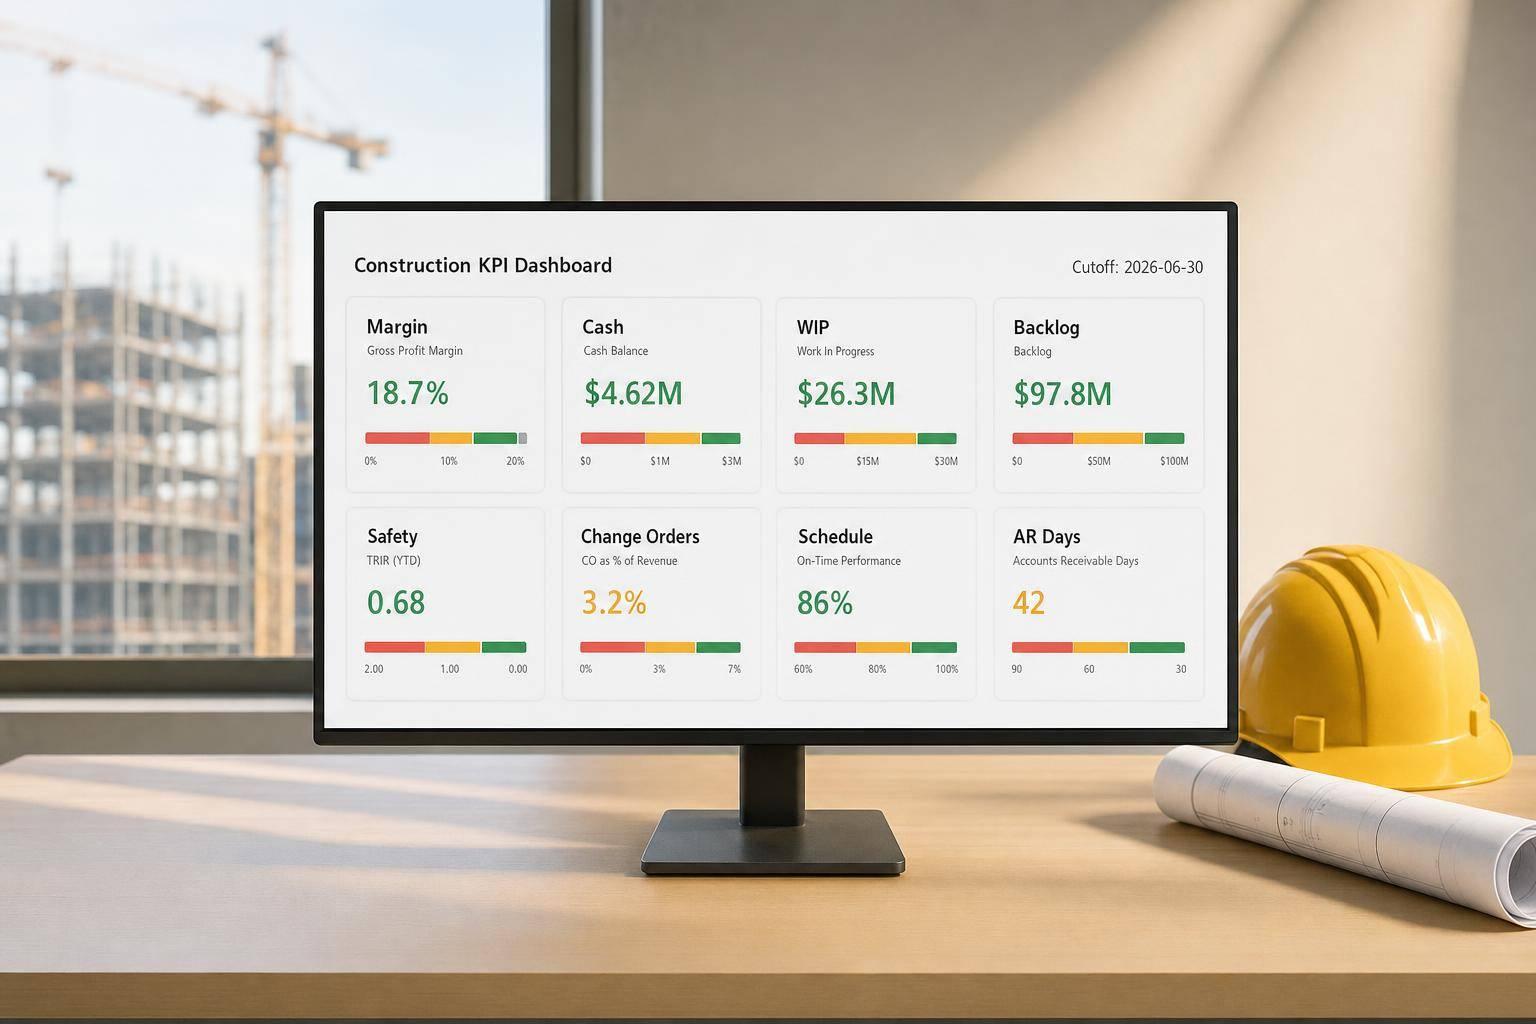
If your dashboard does not help me spot margin fade, cash pressure, billing delays, WIP issues, and backlog risk in minutes, it is too busy.
Here’s the short version: I should keep the main dashboard focused on 6–8 KPIs and use it to answer five basic questions. Are jobs still on track for profit? Is cash going out faster than it comes in? Are change orders stuck? Do WIP and percent complete match job progress? And does backlog support the next 6–12 months of revenue and staffing?
The article’s main point is simple: a construction KPI dashboard works only when I lock down one cutoff date, one set of formulas, and clear owners for each metric. Weekly reviews should focus on exceptions like a 2.0-point gross margin drop, AR past 60 days, or change orders sitting more than 30 days. Monthly reviews should tie WIP, AR, retainage, and contract balances back to the general ledger.
Here’s what matters most:
A few numbers from the article make the point fast:
My takeaway: the dashboard should not be a dump of reports. It should be a short decision tool for weekly action and monthly close, with each number tied to one owner and one next step.
Once the KPI list is set, the next move is to standardize the data behind it. Before you build a single chart, lock down one accounting basis, one cutoff date, and one reconciled source set. If the source systems don’t line up to the same as-of date, the dashboard won’t mean much.
Pull data straight from the GL, job-cost ledger, contract and change-order register, billing register, AR aging, and WIP schedule. Those sources drive gross margin, WIP, collections, and backlog. Keep actual, committed, and forecast costs in separate lanes. If you blend them together, margin and burn-rate reporting gets muddy fast.
After the source data is locked, use monthly reconciliation to confirm the numbers are fit for reporting. Reconcile job-cost detail to the GL, billings to issued invoices, earned revenue to the income statement, and overbilling and underbilling to the balance-sheet accounts.[4] Any variance above the set threshold should be logged with the cause and the date it will be resolved.[5] Weekly dashboards can run on an operating cutoff, but they should clearly show that the data is preliminary and separate it from the finalized monthly close.
A data dictionary spells out what each KPI is, how you calculate it, where the data comes from, and who owns it. Without that, teams tend to tweak formulas from one period to the next. Then month-over-month comparisons start to fall apart.
For each KPI, document the definition, formula, source fields, accounting basis, project scope, owner, reporting cadence, threshold, and required management action. Also spell out whether the value is actual, committed, forecast, approved, or pending. That way, no one treats a proposal or an unapproved change order like contracted revenue.
Use this structure for every KPI:
| KPI | Formula | Primary source | Owner | Cadence |
|---|---|---|---|---|
| Gross margin | (Revenue − Job cost) ÷ Revenue | GL, job-cost ledger, WIP schedule | CFO / controller | Monthly; weekly by project |
| Burn rate | Average cash consumed per week or month | Bank activity, payroll, AP, forecast | CFO | Weekly |
| Earned revenue | Percent complete × revised contract value; percent complete is generally actual costs to date ÷ estimated total costs | WIP schedule, job-cost report, contract register | Controller / project manager | Monthly |
| Overbilling | Billings to date − earned revenue | Billing ledger, WIP schedule | Controller | Monthly |
| Underbilling | Earned revenue − billings to date | WIP schedule, accounts receivable, billing ledger | Project manager / controller | Monthly |
| Backlog | Signed contract value not yet performed or remaining revenue to be recognized | Contract register, WIP schedule | Founder / sales lead | Monthly |
| Change-order aging | Days since a change order was identified or submitted without approval | Change-order log | Project executive | Weekly |
| DSO | Average days to collect receivables | AR aging, revenue, cash receipts | Controller / AR lead | Monthly |
Watch sign conventions for overbilling and underbilling. Some systems flip the sign, which can throw off reporting if no one catches it.[1][2] Also, don’t include unapproved amounts in contracted backlog or forecast revenue unless the company has a written policy and labels those amounts as forecast or risk-adjusted value.[3]
Every KPI needs one owner. Not a group. Not a shared inbox. One person.
Project managers own percent complete, cost-to-complete estimates, pending change orders, and project-level margin explanations. The controller owns WIP, earned revenue, GL reconciliation, and cutoff integrity. The AR or finance lead owns collections, DSO, retainage, and disputed receivables. The CFO or founder owns cash burn, portfolio margin, and escalation calls.
Thresholds are what turn ownership into action. Set them before the review, not during it. Use both dollar and percentage triggers, because context matters. A small percentage swing on a large job can hit a lot harder than the same swing on a smaller one. A practical place to start is escalating a gross-margin drop of 2.0 percentage points on any active project, a change order pending for more than 30 days, or an AR balance aging past 60 days.[5] Each threshold should name the owner, the deadline, and the response that’s expected.
You should also build data checks right into the dashboard, so data problems sit in plain view next to the financial results. Add indicators such as:
If margin drops and costs are missing, that’s a data problem. If margin drops and the numbers show rising costs plus a revised estimate, that’s a performance problem.
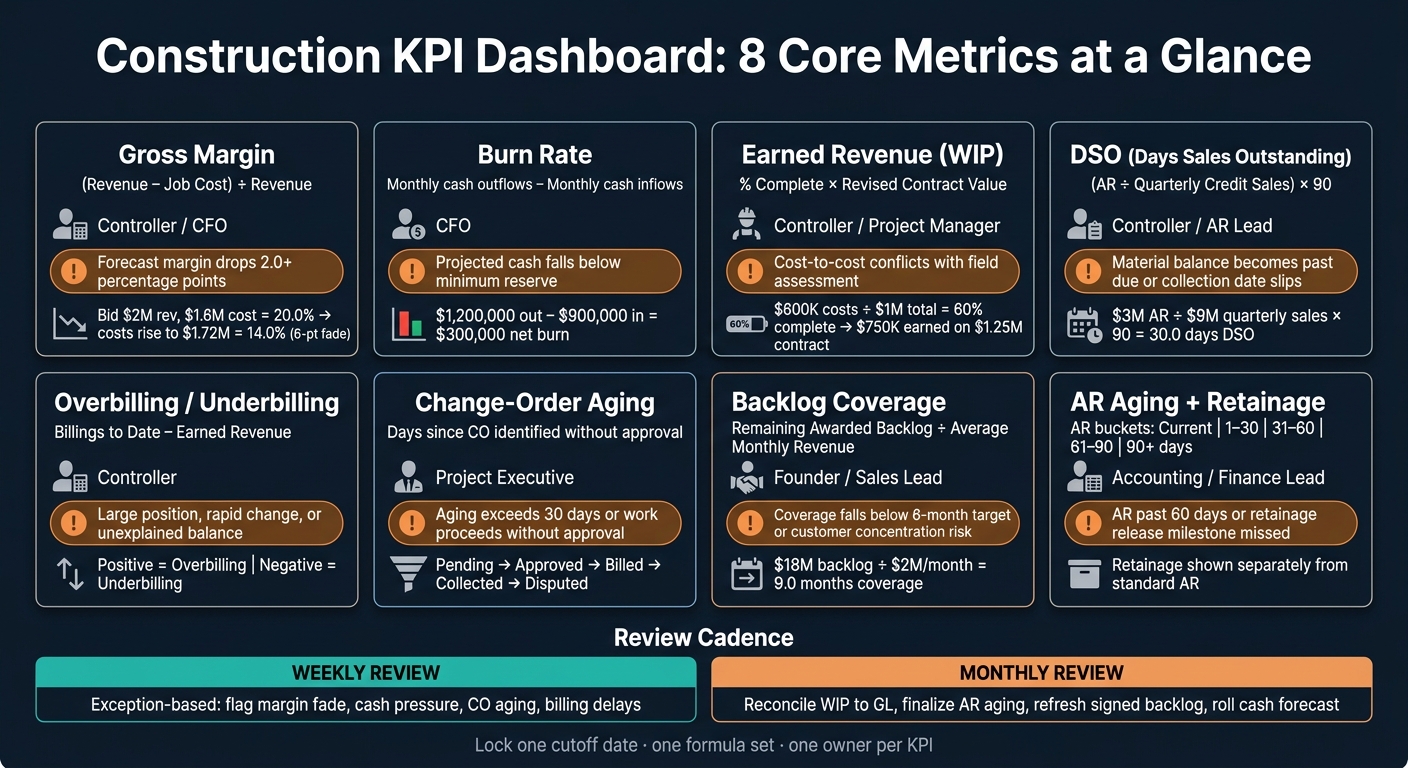
Construction KPI Dashboard: 8 Core Metrics, Owners & Escalation Triggers
Once your data sources are set and each metric has an owner, the next job is simple: know what each KPI is saying and what action it should prompt in an operating review. These KPIs help you tell the difference between a weekly exception and something that belongs in the monthly close.
Track bid margin, projected margin at completion, and realized margin side by side. Looking at just one number won't tell you much. The gap between bid margin and projected margin is margin fade, and it's one of the clearest early warnings of estimating mistakes, labor productivity issues, or scope creep.
Here's what that looks like in practice. A project bid at $2,000,000 in revenue with $1,600,000 in direct costs starts with a 20.0% bid margin. If revised estimated costs move up to $1,720,000, projected margin falls to 14.0%. That's a 6-point fade. That kind of move should trigger a cost-to-complete review before month-end close, not after.
Use one burn-rate definition across the company. For most contractors, the most useful version is monthly cash operating outflows minus cash operating inflows, excluding financing activity unless the dashboard says otherwise. If a contractor pays out $1,200,000 in a month for project costs and overhead and collects $900,000, net burn is $300,000.
Put these together on one view:
That trailing three-month average matters. It helps you see whether you're dealing with a one-off spike or a deeper cash issue.
Change orders need their own funnel. A single "change order total" tends to hide the part that hurts. Break the dashboard into pending, approved, billed, collected, and disputed amounts. For each stage, show dollar value, margin impact, submission date, and days in stage.
| Change-order stage | Accounting treatment | Operational risk | Owner | Required action |
|---|---|---|---|---|
| Pending | Exclude from committed revenue unless supportable under contract and accounting policy | Work may proceed without recoverable value | Project manager and contracts lead | Document scope, cost, pricing, and approval status |
| Approved | Update contract value, forecast, and WIP inputs when approval is enforceable | Margin may be overstated if costs aren't updated | Project manager and controller | Update budget, estimate at completion, and billing schedule |
| Billed | Record receivable under normal billing policies | Invoice may not match approved scope | Billing owner | Confirm invoice support and due date |
| Collected | Include in cash reporting and collection metrics | Cash may arrive later than planned | Controller or collections lead | Reconcile receipt to invoice and forecast |
| Disputed | Keep separately identified from collectible AR and approved contract value | Margin, cash flow, and customer relationship at risk | Project executive and finance lead | Escalate dispute, reserve if needed, define resolution date |
Also track cycle time across the full path: submission to approval, approval to billing, and billing to collection. That's where delays tend to pile up.
WIP connects project progress to revenue recognition, billing, and balance-sheet accuracy. If this number is off, a lot of other numbers drift with it.
Percent complete under the cost-to-cost method is:
Costs Incurred to Date ÷ Estimated Cost at Completion
If a project has incurred $600,000 against a $1,000,000 estimated total cost, it's 60.0% complete. On a $1,250,000 contract, that equals $750,000 of earned revenue. The weak spot here is the estimated cost at completion. If project managers understate remaining costs, percent complete gets pushed too high, earned revenue gets pulled forward, and margin looks better than reality.
A WIP schedule should include original contract value, approved and pending change orders, revised contract value, costs incurred to date, estimated cost to complete, estimated cost at completion, percent complete, earned revenue, billings to date, overbilling or underbilling, and projected gross margin. Used well, that schedule helps catch margin drift, billing gaps, and forecast slippage before close.
A positive result from Billings to Date − Earned Revenue is overbilling. A negative result is underbilling. Neither one is good or bad on its own. Context does the heavy lifting.
| Condition | Likely cause | Cash-flow effect | Project risk | Management response |
|---|---|---|---|---|
| Overbilling | Front-loaded billing, advance deposits, billing ahead of progress | Improves near-term cash | Future cash may slow; performance may be misstated if costs are incomplete | Confirm billing terms, validate percent complete, forecast the reversal |
| Underbilling | Work performed before invoicing, delayed change-order approval, missed progress billing | Consumes cash - contractor is financing the work | May signal billing-control failure or unapproved claims; reduces liquidity | Identify invoiceable work, resolve approvals, update billing schedule, escalate large balances |
Growing or persistent underbilling needs a close look. It can point to delayed change-order approvals, weak billing administration, inaccurate percent-complete estimates, or work being done without matching cash collection. In plain terms, the company may be funding the job longer than it should.
On the cash side, the dashboard should show AR aging in standard buckets: current, 1–30, 31–60, 61–90, and 90+ days past due. Break out retainage and disputed balances on their own lines. Retainage receivable may be contractually earned, but it often isn't available until project milestones or closeout. If it sits inside regular AR, the aging picture can look better than it is.
For DSO, use the same revenue basis and period convention every month. If that changes from month to month, trend analysis falls apart. For example, $3,000,000 of AR divided by $9,000,000 of quarterly credit sales, multiplied by 90 days, equals 30.0 days DSO.
Don't stop at DSO. Track the full billing-to-collection cycle too:
That split tells you where the slowdown lives. Is the issue inside your process because invoices go out late? Or is the customer paying slowly? Big difference.
Once cash is clear, the next step is checking whether future work can support it.
Backlog is not cash, and it's not profit. Report backlog by project, division, expected start and completion dates, remaining contract value, projected gross margin, and months of revenue coverage. Backlog coverage in months is:
Remaining Awarded Backlog ÷ Average Monthly Revenue
If remaining awarded work is $18,000,000 and the monthly revenue target is $2,000,000, coverage is 9.0 months. Then pressure-test that number for schedule slippage, margin deterioration, and customer concentration. A large backlog can still be weak if margins are thin, underbilling is high, change orders are disputed, or start dates are more wish than plan.
Once owners, thresholds, and KPI definitions are in place, the dashboard stops being a static report and starts driving the week. Use it in two routines: a weekly exception review and a monthly close-and-forecast cycle.
The weekly meeting is not a walk-through of every chart. It’s an exception review.
Start with the KPIs most likely to shift in the near term: margin, cash, WIP, collections, change orders, and backlog. The goal is simple: find what’s off, decide what happens next, and assign it before anyone leaves the room.
Every red or yellow variance needs:
The dashboard should also carry forward last week’s action status. That way, open items don’t vanish the moment the numbers refresh.
If forecast margin drops below target, the response should be direct. The project manager explains the driver. The finance lead updates the estimate at completion. The owner approves a recovery plan.
Cash pressure needs its own pass. Look at cash on hand alongside a four- to six-week forecast of receipts and committed payments. If any week in that window shows projected cash dropping below the company’s minimum operating reserve, treat it as an immediate escalation.
Weekly reviews bring exceptions to the surface. Monthly reviews check the numbers behind them.
The monthly review should follow the same sequence every time.
Start with month-end close. Reconcile job-cost detail to the general ledger first. Then review any uncoded, late, duplicate, or misclassified costs before moving on. If the ledger is messy, everything downstream gets shaky fast.
Once the ledger is clean, bring in project-manager updates on physical progress, committed costs, remaining work, risks, claims, and change orders. Then refresh every active job with updated estimated total cost, revised cost to complete, recalculated percent complete, earned revenue, and the resulting overbilling or underbilling position.
Document any WIP differences before sign-off. Label the WIP basis clearly. Sign conventions should match the general ledger. That sounds minor, but it saves a lot of back-and-forth later.
After WIP is final, age the receivables, review disputed invoices, update expected collection dates, reconcile retainage by project, and refresh backlog using only contractually awarded work. Pending awards and pipeline should be shown separately, not mixed into signed backlog.
The last step is rolling the cash forecast forward using realistic assumptions. That includes billing milestones, retainage release dates, approved versus unapproved change orders, payroll, subcontractor payments, taxes, debt service, and any major material commitments.
Monthly review should produce three views:
Use the same cadence each cycle so every KPI leads to the same response.
| KPI | Weekly review | Monthly review | Owner | Source data | Escalation trigger |
|---|---|---|---|---|---|
| Gross margin by job | Flag margin fade | Reconcile to closed financials and reset EAC | Project manager and finance lead | Job-cost ledger, budget, committed costs | Forecast margin falls below approved target |
| Burn rate and cash | Check cash runway | Roll forward the cash forecast | Founder or finance lead; controller | Bank, AP, payroll, AR, cash forecast | Projected cash falls below minimum reserve or spending materially exceeds plan |
| Change orders | Review aging and approval status | Tie the register to contracts and WIP | Project manager | Change-order log, contracts, billing system | Aging exceeds policy, work proceeds without approval, or margin impact is material |
| Percent complete and WIP | Flag large movement or data issues | Finalize WIP after close | Controller and project manager | Job costs, contract value, project forecast, billing records | Cost-to-cost progress conflicts with field assessment or financial statements |
| Overbilling and underbilling | Watch for unusual swings | Investigate persistent balances | Controller or finance lead | WIP schedule, progress billings, earned-revenue calculation | Large position, rapid change, or unexplained balance |
| Collections and DSO | Review receipts and overdue invoices | Update AR aging and collection dates | Accounting lead or finance lead | AR aging, cash receipts, invoices, customer correspondence | Material balance becomes past due or collection date slips |
| Retainage | Track expected release dates | Reconcile by project and customer | Accounting lead | Contract terms, AR subledger, pay applications | Release milestone is missed or retainage becomes disputed |
| Backlog and coverage | Review awards, starts, and cancellations | Refresh signed backlog and revenue timing | Founder, estimator, or finance lead | Executed contracts, project schedule, CRM, forecast | Coverage falls below target or backlog is concentrated in one customer or project |
Once the reporting cadence is set, the last piece is day-to-day discipline. Dashboards break down when teams use loose definitions or pull numbers from places no one fully trusts. The best place to start is simple: document the decisions the dashboard needs to support, then work backward to the data needed to answer them.
From there, use this rollout sequence:
For founders and fractional CFOs, this kind of discipline matters when lenders are involved and when capital planning is on the table. AR, retainage, underbillings, overbillings, contract balances, and WIP should tie back to the GL every month.[6]
When those controls are in place, the dashboard stops being a report people glance at after the fact. It becomes a weekly operating tool teams can actually use.
When the build is done, the dashboard should work as one control system. That means using margin, cash, WIP, change orders, collections, and backlog together, not as separate reports living in separate corners of the business.
Weekly reporting is for fast intervention. Monthly reporting is for controlled financial reporting, with a clean close and a reconciled forecast.
Definitions and cutoff dates matter just as much as the charts on the screen. If gross margin means one thing to the project manager and something else to the controller, the dashboard won’t act as a shared tool. It becomes a source of friction. Lock the definitions once, then enforce them at every close.
Use the “So What?” test: if a 10% change in a metric wouldn’t spark discussion or lead to action, leave it out.
Pick KPIs that fit your current growth stage and business goals. Then keep your dashboard tight: 5–8 headline metrics is usually enough. Any more than that, and the signal gets buried in the noise.
Each KPI also needs a few basics nailed down so people can actually use the data:
That way, the dashboard doesn’t just show numbers. It helps your team decide what to do next.
Match your review rhythm to the speed of the decision in front of you.
Weekly: cash balance, burn rate, runway, 13-week cash forecast, A/R and A/P aging, collections, pipeline coverage, staffing and capacity, and active project cost variances.
Monthly: finalized financial statements, budget-to-actual variances from closed books, gross margin, EBITDA, expense categories, project profitability, client retention, and long-term forecasting.
Integrate your core systems - like ERP, CRM, and project management software - into one data pipeline so your team can cut manual entry and avoid spreadsheet mistakes.
Create a single source of truth by defining each KPI once. Then use automated data checks to keep inputs clean, and reconcile on a regular basis against your general ledger and bank balances.