Published on
August 21, 2026


Growth can drain cash even when sales are up. If I’m scaling, I can run short on cash because money often goes out now and comes back 30 to 90 days later.
Here’s the short version: I need to watch 7 cash flow risks that can shrink my buffer fast:
A simple way I think about this is my liquidity buffer: cash on hand plus available credit compared against fixed monthly costs. If fixed costs are $150,000 per month, I’d want about $450,000 for a 3-month buffer or $900,000 for a 6-month buffer.
At $1,000,000 in monthly revenue, even a DSO move from 30 to 45 days can tie up about $500,000 more in receivables. And if one customer makes up 20%+ of revenue, one delay can hit both cash and loan headroom at the same time.
Quick Comparison
| Risk | What happens | What I watch |
|---|---|---|
| DSO creep | Cash gets stuck in AR longer | DSO, AR aging |
| Vendor term mismatch | Cash leaves before collections arrive | DPO vs. DSO |
| Inventory/prepaids | Cash gets locked before sales convert | Inventory days, sell-through |
| Front-loaded spend | New costs hit before revenue does | 13-week cash impact |
| Seasonality | Slow months cut inflows | Buffer before weak periods |
| Weak forecasting | Revenue looks fine, cash does not | Weekly 13-week forecast |
| Concentration/covenants | One customer issue can squeeze liquidity fast | Customer share, covenant headroom |
If I’m growing from $500,000 to $10,000,000 in annual revenue, this is the core check: Will my lowest projected cash plus credit stay above my buffer target? If not, I need to act before the problem turns into a cash crunch.
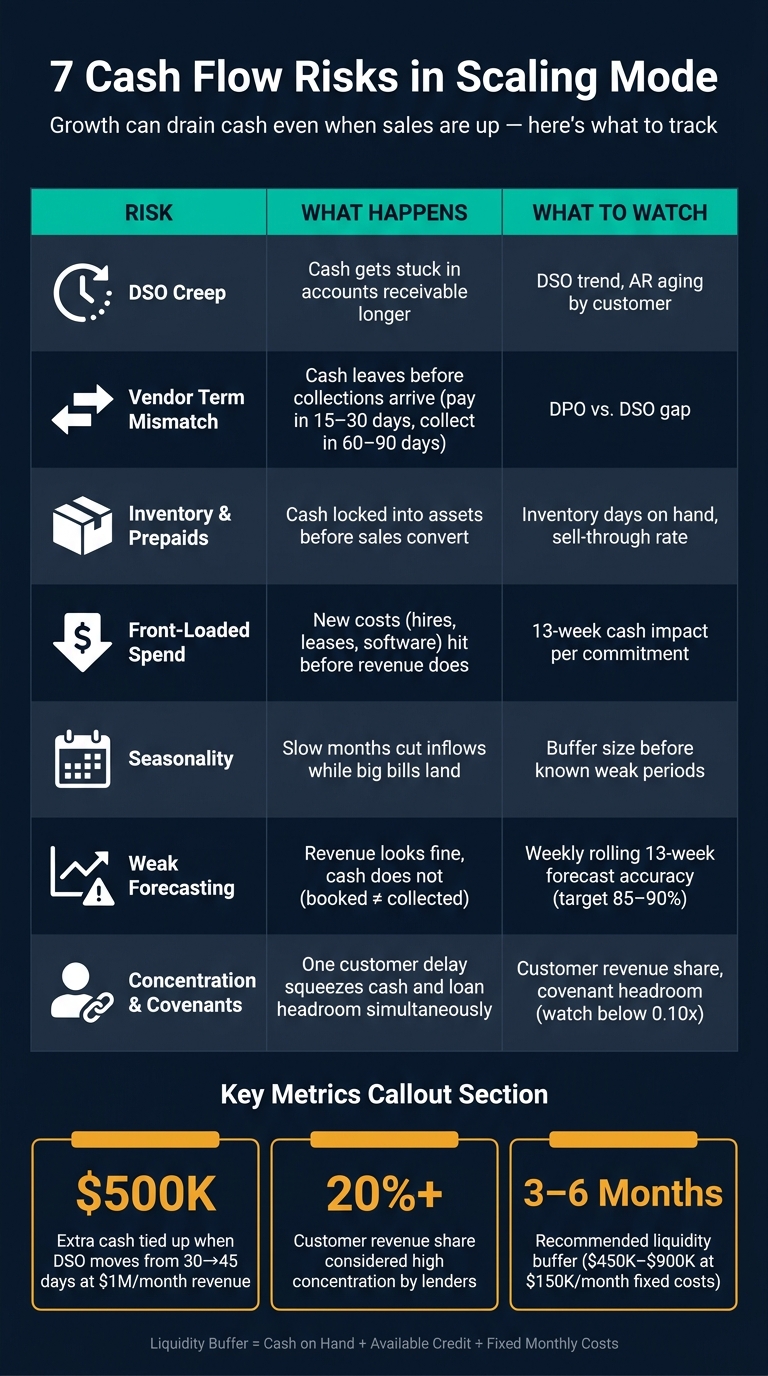
7 Cash Flow Risks When Scaling: What Happens & What to Watch
Working capital is often the first place growth starts to eat into your cash buffer. The cash conversion cycle is the stretch between paying out cash and getting it back. When a business scales fast, that stretch often gets longer. And when it does, cash gets stuck in places that don't look dangerous at first glance.
The three biggest pressure points are usually receivables, payables, and inventory.
Days Sales Outstanding (DSO) measures how long it takes, on average, to collect payment after a sale.[1][2][3] When DSO starts creeping up, more cash sits in receivables for longer periods, which cuts into your buffer.
At $1,000,000 in monthly revenue, moving from 30 to 45 days in DSO ties up about $500,000 more in receivables. That's a big chunk of cash to have sitting on the sidelines. The problem gets worse when a few large customers start paying late.
Track DSO every month, and break it out by major customer. Review AR aging every week so late payments don't drift by unnoticed. Apply Net 30 terms the same way across the board, and use a simple follow-up rhythm:
A customer whose payment pattern is getting worse can be an early warning sign, even if their sales volume still looks strong.
If collections are slowing down, the next place to look is vendor terms.
This problem shows up when vendors want payment in 15 to 30 days, but customers take 60 to 90 days to pay.[4][5][6] If you pay vendors in 20 days and customers pay in 75, you're covering a 55-day gap out of your own cash.
Track DPO next to DSO so you can see the whole timing mismatch. Push for longer vendor terms where you can, and stagger large purchase orders so cash leaves the business closer to when collections come in. The point is simple: line up outflows with inflows as tightly as possible.
But even better timing won't solve the problem if cash is sitting in inventory or tied up in prepaids.
Excess inventory and upfront payments both turn cash into non-cash assets before you've earned anything back from them.[7][8] Buy too much inventory, or prepay too far in advance, and cash gets locked away fast.
Tie purchasing to actual sales velocity, not best-case forecasts. Watch inventory days on hand and sell-through rate closely. If inventory value keeps rising while revenue doesn't keep pace, cash is being absorbed faster than it's coming back through sales.
For prepayments, use a simple test: does the discount clearly beat the loss of liquidity? Paying too far ahead reduces your room to handle delays, and that risk won't show up on the income statement. If the liquidity cost is bigger than the savings, the prepayment is too expensive for a scaling business.
Once working capital is under control, the next risk is simpler than it sounds: spending cash now and waiting too long for the money from growth to show up.
Growth costs usually hit first. Cash goes out for hires, leases, annual software, and paid acquisition well before the related cash comes in. A new hire is a good example. You start paying salary and benefits right away, but the added revenue may not show up for weeks or even months.
That’s why each new commitment needs two dates attached to it: the cash-out date and the expected collection date. From there, ask one plain question: how much cash leaves before new revenue arrives?
A simple guardrail helps here. Approve new fixed commitments only if the 13-week forecast still stays above your buffer after a 20% revenue drop for three months. If it doesn’t, push the expense back or change the structure.
Even when a company spends with care, liquidity can still get tight when demand slows at times you could have seen coming.
Demand doesn’t move in a straight line. Retail and e-commerce tend to spike in Q4. B2B services often slow in the summer. Construction and education each have their own patterns too. If your cash plan acts like every month looks the same, low-season pressure will almost always look smaller on paper than it feels in real life.
And it gets worse when big bills land at the same time. Tax payments, insurance, and renewals often show up during slower months, right when inflows are at their weakest.
A better rule of thumb:
Seasonality isn’t the problem. Ignoring the timing is.
The last operating risk is a forecast that looks fine on revenue and still misses the cash picture. The usual mistake is mixing up booked revenue with collected cash. A signed contract does not fund payroll - collected cash does.[9][10][12] When teams plan around revenue instead of actual receipts, they tend to overstate near-term liquidity and realize too late that the buffer is shrinking.
The fix is pretty direct. Use a weekly rolling 13-week forecast, because monthly updates leave too much blind spot. Keep booked revenue and expected cash receipts on separate lines. Then run base, downside, and growth cases so you can see how fast buffer months fall if collections slow down or a key customer pays late.
Done well, a 13-week forecast should land in the 85–90% accuracy range when assumptions stay current and variance analysis happens each week.[11]
Even a solid 13-week forecast can miss two things that move fast: customer concentration and debt covenants. When one of them gets hit, your cash cushion can shrink in a hurry.
Most scaling companies know a small group of customers drives a big share of revenue. But far fewer quantify what that means for cash if one key account pays late, cuts orders, or leaves.
Research across 1,503 firms found that higher sales concentration among top customers increases cash flow volatility by +6.12% and cash shortfall risk by +10.70%.[18] In day-to-day finance work, many lenders and investors view a single customer at 20% or more of revenue as high concentration, and they often want the biggest customer below 15%.[13][22]
To keep an eye on this, review these metrics for each major customer every month:
Here, customer-level DSO tells you more than company-wide DSO. One slow-paying account can put pressure on cash even when the top-line DSO number looks fine.
A delay from one large customer can hit you twice: lower cash receipts and less covenant headroom.
Run a stress test based on a 30- to 60-day delay from your largest customer. Push out the expected cash receipts, then recalculate cash balance, liquidity buffer, and covenant ratios. For many scaling companies, this is the point where the buffer starts to wear thin.
Debt covenants make the picture tougher. Loan agreements often include minimum liquidity thresholds, maximum leverage ratios, fixed charge coverage tests, borrowing base limits, and eligibility rules. If a concentrated customer pays late, EBITDA can drop, leverage can climb, coverage can weaken, or receivables can age into ineligible buckets. That can cut borrowing base availability or trigger a covenant breach, which may block more draws, increase interest rates, or accelerate repayment.[19][20][21]
The data shows this is not rare. Studies report a 15.9–16.1% covenant violation rate across large loan samples,[15] and about one-third of loans breached at least one covenant during the 2008–09 stress period.[14]
A practical move is to map each major customer to the covenant it could pressure, then review that map every month. Also track covenant headroom as a numeric figure, not just a pass/fail signal. If headroom on a key ratio drops below 0.10x, or if a projected breach is less than two quarters away, call your lender early.[16][17]
Seven risks. One shared issue: cash timing.
DSO creep, vendor term mismatch, inventory and prepaid cash lockup, front-loaded spend, seasonality gaps, weak forecasting, and customer concentration or covenant triggers can all chip away at your liquidity buffer. And they can do it quietly, even when revenue is growing fast.
The fix starts with visibility. Put the seven risks into one dashboard. Track DSO, DPO, inventory days, customer concentration, covenant headroom, and a rolling 13-week forecast in one place.
Then use those numbers for a quarterly stress test. Check:
If any of those checks look weak, your buffer is already wearing down. Many scaling companies set a buffer based on volatility and customer concentration. Review that target at least twice a year, and right after any major event, like a new debt facility, a large customer win or loss, or a major hiring ramp.
If the buffer starts drifting toward the low end, cut discretionary spend before the problem turns into a crisis.
Scaling safely isn't just about growing revenue. It's about managing when cash comes in and when it goes out with the same level of discipline. Phoenix Strategy Group helps growth-stage companies build the forecasting, FP&A, and data discipline needed to stay ahead of these risks as they scale.
A common rule for growth-stage firms is to keep at least 6 months of runway for operating expenses, plus an extra 15% cash buffer to handle the bumps that often come with scaling.
It also helps to hold back 10% to 15% of total cash for strategic flexibility. On top of that, set a board-approved liquidity floor that triggers immediate cost controls if runway drops below it.
The right target depends on your risk profile. If you deal with longer sales cycles or heavy seasonality, for example, you may want more breathing room.
Maintain a rolling 13-week cash flow forecast and update it every week. Lay out weekly cash coming in and going out so you can spot any week when available cash gets close to, or slips below, your minimum operating buffer.
Done well, this can show cash shortfalls 4 to 12 weeks ahead. It also helps to track leading indicators like sales pipeline velocity and customer acquisition costs alongside your weekly liquidity checks.
Usually, cash flow problems start with timing, not because the business isn’t making money. Sales can look strong on paper, but cash often shows up late. Meanwhile, payroll and vendor bills are due first.
That gap can get bigger when a company spends more on hiring, inventory, or marketing before those costs bring in revenue. That’s why it helps to watch the cash conversion cycle and keep a weekly cash forecast. Both make it easier to spot mismatches early, before they turn into bigger problems.