Published on
September 9, 2026


If I had to reduce this topic to one rule, it would be this: I use CLV to decide where to invest, and CAC to decide how much I can afford to spend.
Looking at only one number is where bad budget calls start. A low CAC can hide weak-fit customers. A high CLV can make me ignore slow payback and cash strain. The fix is simple: I look at CLV:CAC ratio, payback period, and segment-level data together.
Here’s the whole article in plain English:
A few numbers from the article make the point fast:
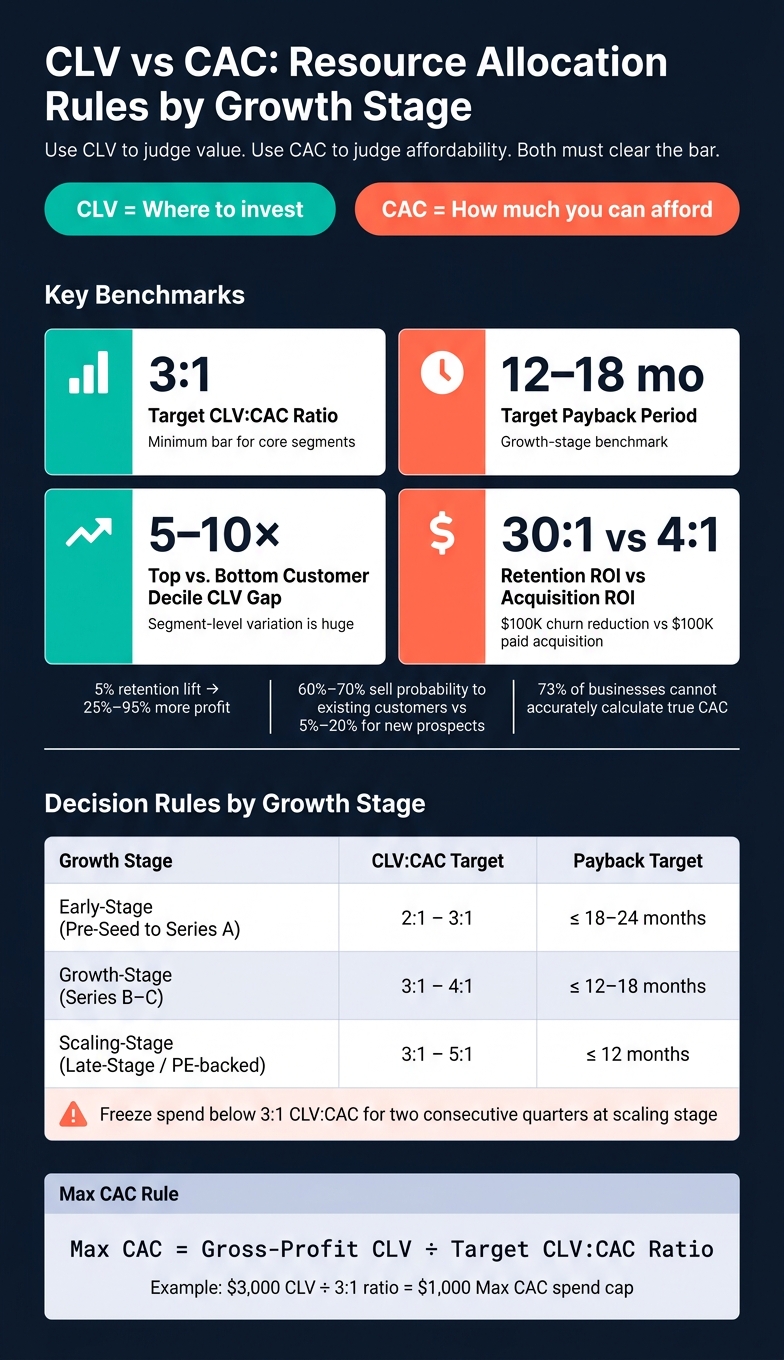
CLV vs CAC: Resource Allocation Rules by Growth Stage
| Metric | What I use it for | Main question it answers | Main risk if used alone |
|---|---|---|---|
| CLV | Rank segments, products, and retention work | Which customers are worth more over time? | I can overspend if payback is too slow |
| CAC | Set spend caps and channel limits | What did it cost me to win a customer now? | I can chase cheap customers who churn fast |
So the rule is straightforward: I don’t scale a segment just because CAC looks low, and I don’t fund a segment just because CLV looks high. Both numbers have to clear the bar at the same time.
Use CLV when you need to decide which customers deserve more sales, marketing, or product spend. Once CAC is past the payback threshold, CLV helps you figure out where the next dollar should go.
When you calculate CLV by segment - industry, deal size, plan type, geography, or acquisition source - the gaps can be huge. Top customer deciles can be worth 5–10× more than bottom deciles.[2][3][6]
Take a U.S. B2B SaaS company as an example. Mid-market healthcare customers on an annual "Pro" plan generate $12,000 in lifetime gross profit. Small retail customers on a monthly "Starter" plan generate $3,000. The CLV:CAC ratios look similar - 4:1 vs. 3.75:1 - but the total dollars created per customer are much higher in healthcare. That gap gives you a clear reason to put more sales coverage, more marketing budget, and more product work into the segment that creates more long-term value, even if CAC is higher.[2][3]
CLV also helps you see when post-sale spend creates more value than putting another dollar into acquisition. Retention, upsell, cross-sell, and repeat purchases all flow straight into lifetime gross profit. So CLV gives you one shared yardstick for comparing acquisition spend with customer success, onboarding, and churn reduction.
The case for shifting budget can be pretty hard to ignore. A 5% increase in customer retention is linked to a 25%–95% improvement in profits, and the probability of selling to an existing customer is 60%–70%, compared with 5%–20% for a new prospect.[7][8][9]
When those numbers fit your business, the case for more budget in onboarding, account management, and churn reduction stops being a gut feeling and starts being measurable. Say a $100,000 churn-reduction effort cuts annual churn in a key segment from 20% to 10% and lifts CLV per customer from $6,000 to $9,000 across 1,000 customers. That adds $3 million in lifetime gross profit on $100,000 spent - a 30:1 return.
Now compare that with putting the same $100,000 into paid acquisition at $1,000 CAC with a $4,000 CLV per customer. That produces $400,000 in lifetime gross profit - a 4:1 return. In a case like this, it makes sense to move spend from acquisition to onboarding, account management, or churn reduction when those levers lift CLV faster.
CLV works best when you're ranking long-term value. It does not work as a stand-in for spend caps.
| CLV Is Useful | CLV Can Mislead | |
|---|---|---|
| Time horizon | Long-term segment and product prioritization | Short-term acquisition decisions where payback speed matters most |
| Use cases | Ranking segments, backing retention investment, setting pricing floors | Short-term acquisition spend limits |
| Data needs | Needs cohort data, margin inputs, and retention curves by segment | Thin or early-stage data can lead to shaky estimates |
| Common failure points | - | Overstated lifespan assumptions; using revenue instead of gross profit; a single "average" CLV that hides segment variation |
The mistake that shows up most often is using revenue instead of gross profit in the CLV formula. That makes the number look bigger than it should and can make acquisition seem more efficient than it is.[4][5][6] A single company-wide CLV can also hide cross-subsidization and send budget in the wrong direction.
After CLV helps rank the best segments, CAC tells you the most you can afford to pay to win them. It acts like a guardrail for cash discipline and spend caps. Put simply, CAC shows what you spent to bring in a customer during a recent period, based on actual costs and actual customer counts. That near-term view makes it the right metric when you need to control burn, set channel budgets, or put limits on acquisition with the help of a fractional CFO based on observed economics.
The most practical use of CAC is the payback period. That means the number of months of gross profit needed to earn back what you spent to acquire a customer.
CAC Payback (months) = CAC ÷ monthly gross profit per customer[10][11][12][13]
When you set channel-level CAC caps from payback targets, your acquisition budget stays tied to cash reality instead of growth goals on paper.
Low CAC can look like a clear win. But it says nothing about what happens after the customer signs up.
That’s the catch. A low CAC number doesn’t help much if the cohort churns fast or only buys when there’s a discount. Cheap acquisition that keeps bringing in low-quality cohorts adds up over time and quietly weakens unit economics.[14][16][17][18]
CAC is useful for budget control because it’s simple, fast, and easy to compare across channels. But it gets risky when people treat it as a stand-in for overall business health.
| CAC Is Useful | CAC Can Mislead | |
|---|---|---|
| Budget control | Sets hard spend limits and payback thresholds by channel quickly, from recent spend and new-customer counts | Fast measurement can push short-term optimization while hurting cohort quality; ignores retention, expansion, and churn |
| Channel comparison | Shows which channels bring in customers at a lower cost | Low-CAC channels may keep producing low-CLV customers |
| Cohort quality | - | Treats all new customers as equal, no matter fit, margin, or support burden |
One risk doesn’t get enough attention: 73% of businesses reportedly cannot accurately calculate their true acquisition costs[19] because they leave out salaries, tools, and agency fees and count only ad spend. That makes CAC look lower than it is and can create a false sense of efficiency.
For actual decision-making, use fully loaded CAC, including all sales and marketing costs.[15][18][20]
Use CAC to cap spend. Use CLV to decide where that spend should go.
Use CLV to set the ceiling and CAC to set the floor. Once you know what each metric tells you, the next move is simple: turn them into rules your team can actually use.
Set budget limits using gross-profit CLV, not top-line revenue.
Then apply the Max CAC rule:
Max CAC = gross-profit CLV ÷ target CLV:CAC ratio
Here’s the math. If gross-profit CLV for a segment is $3,000 and your target CLV:CAC ratio is 3:1, your maximum CAC is $1,000. That number becomes your spending cap for ads, sales commissions, and partner fees in that segment.
Payback should act as your cash guardrail. A stronger ratio doesn’t help much if it takes too long to get the cash back. For growth-stage companies, a payback target of 12 to 18 months is the usual benchmark[30][29].
Once spend limits are clear, use the same unit economics to rank where your team spends time.
Point headcount and budget toward segments that pass both a value threshold and an efficiency threshold. Value means CLV is high enough to support service costs and growth plans. Efficiency means CLV:CAC is above your minimum bar - usually 3:1 for core segments - and payback lands inside your target window[23][25][26].
If a segment falls below that efficiency floor, cap spend and move capacity elsewhere. Only scale it back up when the economics get better. Shift sales and customer success effort toward segments where net revenue retention is above 110% to 120% and expansion revenue shows up on a steady basis[23][25][27][26][24].
As a company grows up, the rules should get tighter.
| Growth Stage | CLV:CAC Target | Payback Target | Primary Use of Metrics |
|---|---|---|---|
| Early-stage (pre-Seed to Series A) | 2:1–3:1[21] | ≤ 18–24 months[29] | Compare segments; identify which ICP can reach 3:1+ |
| Growth-stage (Series B–C) | 3:1–4:1[21][22] | ≤ 12–18 months[29][30] | Enforce channel budgets; deprioritize weak segments monthly |
| Scaling-stage (late-stage / PE-backed) | 3:1–5:1[21][22] | ≤ 12 months[28][30] | Board-level capital allocation; freeze spend below 3:1 for two consecutive quarters[21] |
The rule is simple: use CLV to judge value and CAC to judge affordability. If a company looks only at CAC, it can end up buying cheap customers who never turn profitable. If it looks only at CLV, it can end up spending too much on attractive segments that cost too much to win or take too long to pay back.[31][1][34] CLV shows where to invest. CAC sets the limit on what you can afford.
That only works if you measure both the same way every time. Use gross-profit CLV and fully loaded CAC across all segments and channels. If you change the inputs halfway through, your trend lines stop meaning much.
Once those inputs are fixed, use the metrics side by side. Look at CLV:CAC and payback period together. Both need to clear the bar.[31][32][33] This is where many teams get tripped up. The lowest CAC doesn't always point to the best segment.
A segment with modest revenue, strong retention, and high gross margin can beat a bigger segment that looks cheaper to acquire but churns fast. That's why CLV helps rank investment priorities, while CAC keeps spending in check.
You also need to revisit the numbers on a regular basis. Resource allocation works only when the inputs are current. Use cohort analysis to check whether recent customers still line up with past CLV and CAC assumptions.
Phoenix Strategy Group helps growth-stage companies put CLV and CAC into practice with FP&A, data, and CFO support.
Use gross profit, not top-line revenue.
That means you should subtract all COGS to get your true gross margin, including:
For growth-stage businesses, use this formula:
CLV = (ARPU × Gross Margin %) ÷ Monthly Churn Rate
If churn swings a lot from month to month, use a longer time period or an average churn rate instead.
If you want a tighter estimate, use cohort-based modeling or CM2.
Use a fully loaded CAC that includes all acquisition-related costs, not just ad spend.
That means factoring in:
If you're a product-led growth company, include R&D costs tied to acquisition too. That gives you a more accurate view of your growth economics.
Put retention first when churn is so high that customers don’t stay long enough to pay back what you spent to acquire them. If people leave too early, spending more on marketing can dig the hole deeper.
Focus on retention when churn is high, gross retention is below about 85%, or net revenue retention is below 100%. Better onboarding and stronger customer success can increase lifetime value and support unit economics that actually work.