Published on
September 23, 2026


A cash forecast should tell me one thing fast: when cash gets tight, by how much, and what I need to do next. It is not a budget. It is a decision tool for payroll, vendor payments, taxes, debt service, minimum cash, and funding timing.
Here’s the short version:
A few numbers set the tone. The article points to target accuracy of about ±5% for daily, ±5% to ±10% for weekly, and ±10% to ±15% for monthly forecasts. It also cites an IDC survey where 80% of finance leaders lacked confidence beyond one month, and 95% lacked confidence beyond three months. That tells me one thing: most teams need tighter review, clearer ownership, and better variance tracking, often managed by a fractional CFO.
If I boil the piece down, the message is simple: build the forecast around decisions, not around the calendar or the spreadsheet. That means showing the date cash falls below threshold, linking each line to an owner, and turning forecast error into a cash cushion the team can use.
| Topic | Main takeaway |
|---|---|
| Forecast purpose | Support payment and funding decisions, not profit tracking |
| Best short-term format | Daily when timing risk is high |
| Default treasury format | Weekly rolling 13-week forecast |
| Long-range format | Monthly for directional planning |
| Accuracy focus | Track variance, bias, and revisions by line item |
| Buffer setup | Separate minimum cash, forecast reserve, and stress liquidity |
| Internal transfers | Remove from consolidated liquidity |
| Debt capacity | Count only committed, drawable funding |
| Update cadence | Weekly at minimum; daily when liquidity is tight |
Below, I’d frame the article as a plain guide to building a forecast that helps treasury act before a cash gap turns into a payment problem.
Cash forecast accuracy should match the decision you're making and the time frame you're looking at. Short-term forecasts need to be tighter. Longer-range forecasts can live with more spread.
A good starting point looks like this: about ±5% for daily forecasts, ±5% to ±10% for weekly forecasts, and ±10% to ±15% for monthly forecasts or 13-week rolling forecasts.[2]
That said, context matters. A company with steady subscription revenue can often stay inside tighter ranges. A high-growth business or a project-based company may need more room. The right threshold depends on what's at stake. If the forecast is there to protect minimum cash, payroll, or debt service, use the tighter end of the range.
One benchmark stands out: a 2022 IDC survey found that 80% of finance leaders were not confident in cash forecasts beyond one month, and 95% lacked confidence beyond three months.[4] That doesn't mean teams should shrug and accept weak forecasting. It points to a more basic issue: many teams aren't measuring forecast accuracy closely enough to get better.
A single ending-cash miss doesn't tell the whole story. It can hide errors that cancel each other out on paper. That's why accuracy should be measured by category and entity, not just by the final cash number.
It also helps to track bias. In plain English, bias shows whether the forecast keeps overstating inflows or understating outflows. If that keeps happening, treasury can end up with a false sense of liquidity. And that can push financing decisions too far down the road.
When a miss shows up, classify it before you touch the model. There are three common types:
Timing differences should usually be shifted into the correct future bucket. Business-change variances are different. They call for an update to the forecast driver itself.
No single metric can show every liquidity risk. Use these four together:
| Metric | What it measures | Most useful when |
|---|---|---|
| Absolute variance | Dollar difference between actual and forecast | Assessing whether a miss exceeds a materiality threshold |
| Percentage variance | Relative miss as a percent of forecast | Comparing categories or entities of different sizes; avoid when forecast is near zero |
| Bias | Average signed error over time | Detecting repeated overstatement or understatement across weeks or months |
| Forecast revision | Difference between current and prior forecast for the same future period | Spotting assumption shifts or newly known cash events before the period closes |
Track all four by category and by horizon. Then add a short root-cause note to each one. A single accuracy score, by itself, won't tell treasury what went wrong. It also won't show whether the miss came from a process issue or just a volatile week.
After setting the accuracy standard, match it to the right time bucket.
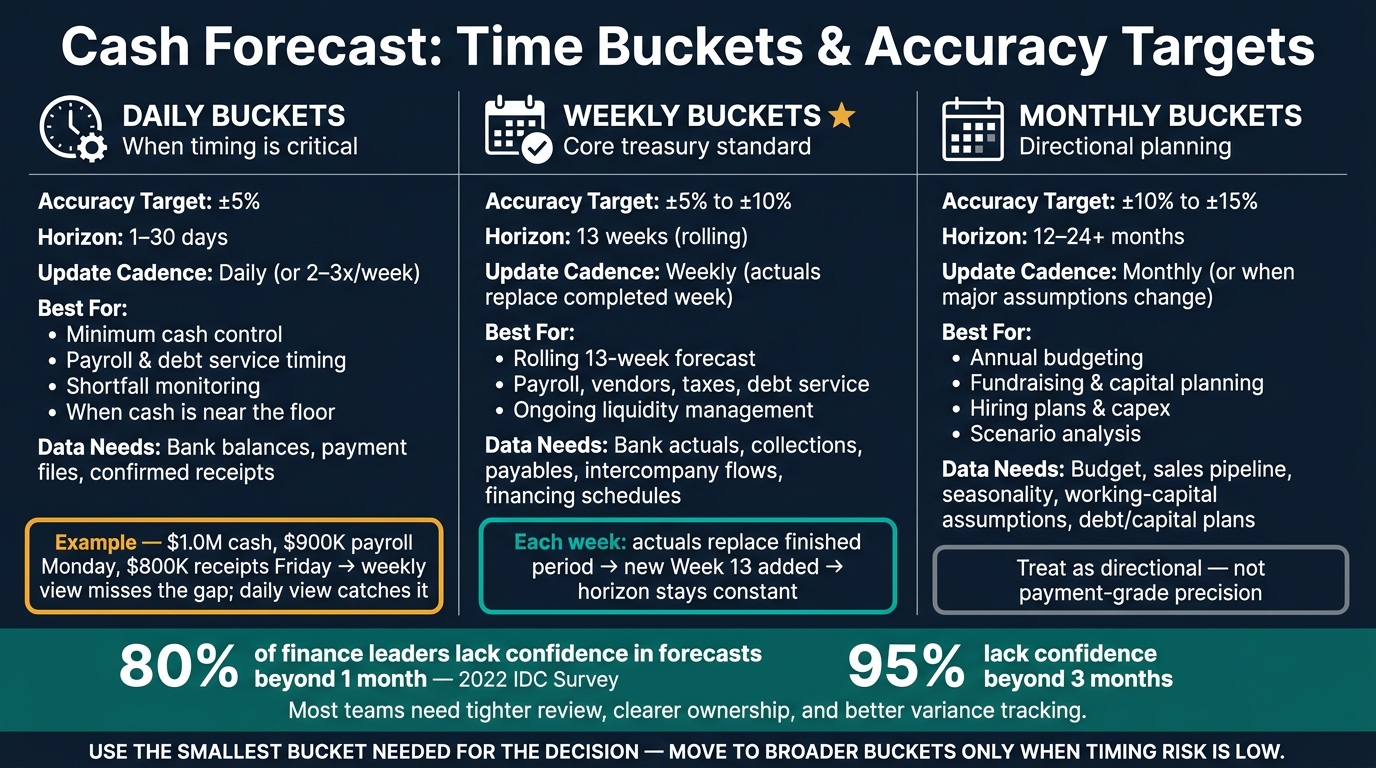
Cash Forecast Accuracy Targets & Time Buckets: Treasury Quick Reference
Choose the bucket that fits the liquidity decision. The time bucket should follow the liquidity decision, not the accounting calendar.
Daily buckets work best when cash timing matters down to the exact payment. If cash is close to the minimum, payroll is heavy, debt service is coming due, or financing hasn’t landed yet, a weekly view can miss a shortfall that happens in the middle of the week. Say a company has $1.0 million in cash, a $900,000 payroll payment due Monday, and $800,000 in customer receipts expected Friday. A weekly forecast might make that week look fine, but a daily model would show the gap right away.[8][3]
Weekly buckets are the default for most treasury teams. A rolling 13-week forecast gives enough detail to manage payroll, vendors, taxes, and debt service without turning into a maintenance headache.[1][6][7] Each week, actuals replace the finished period, a new Week 13 gets added, and the forecast horizon stays the same. If forecast variance starts to spread out, the next issue is how much cash cushion the model needs.
Monthly buckets make more sense beyond 13 weeks. They fit annual budgets, fundraising cases, capital expenditure planning, and hiring plans - cases where the goal is directional visibility, not day-by-day precision. Monthly projections lean more on historical seasonality and business plans, so treat them as directional rather than payment-grade.[5][11][12]
Use the smallest bucket needed for the decision, then move to a broader bucket only when timing risk is low. Keep the same cash-flow structure across all buckets so the views still tie together.[9][10]
| Bucket | Primary purpose | Typical horizon | Data requirements | Update cadence |
|---|---|---|---|---|
| Daily | Payment scheduling, minimum-cash control, shortfall monitoring | 1–30 days | Bank balances, payment files, payroll, taxes, debt dates, confirmed receipts | Daily when liquidity is tight; otherwise 2–3 times per week |
| Weekly | Core operating liquidity management - the rolling 13-week forecast | 13 weeks | Bank actuals, collections, payables, payroll, taxes, intercompany flows, financing schedules | Weekly; actuals replace the completed week, new Week 13 added |
| Monthly | Budgeting, fundraising, capital planning, scenario analysis | 12–24 months or longer | Budget, sales pipeline, hiring plans, seasonality, working-capital assumptions, debt and capital plans | Monthly, or when major assumptions change |
The Association for Financial Professionals notes that forecast frequency should increase as variance in cash-flow data rises.[13] If weekly misses get larger, add daily detail and refresh the forecast more often.
Once treasury measures forecast error, the next job is turning that error into a cash cushion. In plain English: how much room do you need when the forecast is off?
That cushion should have three layers: operating minimum, forecast reserve, and stress liquidity. Each one serves a different purpose, so each one should lead to a different treasury move.
Minimum operating cash covers committed payments such as payroll, rent, debt service, taxes, critical suppliers, and payment processing, based on actual due dates. This is the floor. If cash drops below it, the business can run into trouble fast.
Forecast reserve sits above that floor. It covers normal forecast error, collection delays, timing shifts, and routine surprises. A practical way to size it is to use historical cumulative error at the chosen confidence level.
Stress liquidity is the next layer up. It should include available cash plus committed borrowing capacity under a customer delay, supplier acceleration, or financing stress scenario.
Don’t stop at showing the amount of the shortfall. Show the date each threshold is breached too. That changes the conversation. A downside case that falls below the minimum on a specific date gives treasury a hard deadline, not a fuzzy warning.
| Liquidity level | Meaning | Typical action |
|---|---|---|
| Forecasted ending cash | Expected ending cash under the approved operating forecast | Fund normal operations, invest excess cash according to policy, and continue monitoring |
| Minimum cash threshold | Cash needed to meet committed obligations and maintain essential operations | Freeze or delay discretionary spending, accelerate collections, renegotiate payment timing, and confirm funding availability |
| Stress-case requirement | Liquidity needed to withstand a defined adverse scenario | Draw or arrange committed financing, raise equity if appropriate, reduce variable spending, and activate the contingency funding plan |
Putting every cash flow into one big assumption may look neat on a spreadsheet. But it can hide timing risk, and timing risk is often where cash problems start.
Fixed flows like payroll and scheduled debt payments usually carry high confidence. Use contractual amounts and exact due dates.
Variable flows like customer collections and commissions need a different approach. These should rely on driver-based models, historical conversion rates, aging data, and scenario ranges.
Seasonal flows, such as holiday inventory builds or annual insurance premiums, should use multi-year patterns and current-year operating assumptions. During peak periods, review them weekly.
One-time items need their own lane. Major capex, tax refunds, litigation payments, and acquisitions should be tracked separately with an expected date, amount range, probability, and approval status. If you fold them into recurring assumptions, you can easily hide a material cash need.[14][15]
Here’s the same idea in table form:
| Cash-flow type | Examples | Modeling method | Confidence level | Review frequency |
|---|---|---|---|---|
| Fixed | Payroll, rent, scheduled debt payments, recurring software contracts | Use contractual amounts and due dates; adjust only for known changes | High when contracts and payment dates are current | Weekly for near-term timing; monthly for contract changes |
| Variable | Customer collections, discretionary spending, commissions, usage-based costs | Use operating drivers, historical conversion rates, aging data, and scenario ranges | Medium; depends on data quality and business volatility | Weekly, with variance analysis by owner |
| Seasonal | Holiday sales, annual tax payments, insurance renewals, inventory builds | Use multi-year seasonal patterns, current-year operating assumptions, and event calendars | Medium to high when recurring patterns are stable | Monthly during normal periods; weekly during the seasonal peak |
| One-time | Major capex, tax refunds, litigation payments, acquisitions, restructuring costs | Model separately with an expected date, amount range, probability, and approval status | Low until committed; higher once scheduled | At every forecast refresh until settled |
Next, treasury has to keep intercompany transfers and debt draws from distorting that cushion.
Once the buffer is set, the forecast still needs clean handling of internal funding and debt capacity. The main rule is simple: separate internal transfers from external liquidity. Remove intercompany transfers from consolidated liquidity so internal funding doesn’t show up as new cash.[18][19]
Debt draws work in much the same way. A revolver draw increases available cash and debt outstanding at the same time. Treasury should count revolver capacity only when it is committed, covenant-compliant, and available under borrowing-base and draw conditions.[17]
| Cash source or movement | Entity-level reporting | Consolidated reporting | Scenario analysis |
|---|---|---|---|
| Operating cash from customers, vendors, payroll, taxes, and investments | Include for the relevant entity | Include as external group cash flow | Stress collections, payment timing, and margins |
| Intercompany transfer or internal loan | Show both sending and receiving sides | Eliminate the internal movement | Model delayed, partial, or unavailable funding |
| Committed debt currently available | Show at the borrowing entity | Include as an external financing source if drawable | Stress covenant, borrowing-base, and lender conditions |
| Potential or uncommitted debt draw | Do not treat as certain cash | Exclude from base-case liquidity | Label probability, conditions, and expected timing |
After cash sources are classified the right way, the next job is to keep the forecast current on a fixed review cycle. The rolling 13-week forecast should serve as treasury’s baseline.[20][7] In normal conditions, update it at least weekly. Shift to daily updates when cash is close to the minimum threshold, a major financing is pending, collections are volatile, or covenant headroom is getting tight.[16][20]
Each week, teams should reconcile balances, update settlement dates, refresh funding activity, and recalculate headroom. Then log the variance, owner, fix, and next review date. That sounds simple on paper, but it matters. A forecast is only useful if people can see what changed, who owns it, and when it will be checked again.
Ownership should stay clear and plain:
The final step is turning those updates into a forecast management can use fast.
A cash forecast only matters if it leads to action before cash gets tight. If it just sits in a report, it’s not doing its job.
That’s why the forecast should guide decisions, not just document what happened.
From there, line the forecast up with the decision window in front of you. Use tighter targets for near-term cash, and allow wider ranges as the timeline stretches out. Match the forecast horizon to the decision at hand, and keep minimum cash, reserve cash, and stress liquidity separate.
Seasonality should stay in the base case. Intercompany cash and debt draws should stay separate from operating cash too. That way, management is always looking at available cash - not a blended number that includes funding sources that may not be ready to use.
The forecast also needs to stay current. Reconcile actuals weekly. If cash is tight or collections are moving around a lot, move to daily updates.
For growth-stage teams putting this discipline in place ahead of a fundraise or acquisition, Phoenix Strategy Group can help set up the ownership, reporting, and scenario-analysis processes that turn a basic cash projection into a genuine liquidity management tool.
Start with the actual opening cash balance across all operating accounts each week. Then add weekly inflows, like customer collections based on expected receipt dates and loan draws.
From there, subtract weekly outflows, including payroll on actual pay dates, rent, vendor payments, taxes, debt service, and irregular costs like capital expenditures or inventory commitments.
For the first six weeks, use a bottom-up approach. Build the forecast line by line, using known payment and receipt dates wherever you can. For weeks 7–13, switch to top-down estimates based on broader cash patterns, planned activity, and recent trends.
A common starting point is 3 to 6 months of operating expenses.
For growth-stage companies, a useful rule of thumb is 6 months of runway plus a 15% cash buffer to help absorb the ups and downs that often come with scaling.
Some companies also set aside 10% to 15% of total cash for strategic flexibility. To make that buffer more than just a rough guess, define it with board-approved liquidity floors. And separate operating cash from restricted funds so you can see your true deployable liquidity.
For most growth-stage businesses, the standard play is to update a 13-week cash forecast every week. That rhythm gives teams a solid view of liquidity and helps them spot timing-related risks before they turn into a problem.
If conditions get volatile, or cash is especially tight, it makes sense to move to daily updates. In many cases, controllers already watch daily cash positions. But the 13-week forecast itself is still usually refreshed weekly unless that level of visibility no longer gives the team enough warning.