Published on
September 6, 2026


If your chart of accounts can’t support gross margin, cash burn, and board reporting, it will slow you down as revenue moves from $500,000 to $10,000,000.
I’d keep the goal simple: build a lean chart with about 35–60 active accounts, split revenue, COGS, and OpEx cleanly, use 4-digit account numbers with room between them, and track extra detail with departments, classes, or projects instead of piling on more GL accounts.
Here’s the short version:
A good CoA is not about having more accounts. It’s about having the right accounts, clear rules, and a structure your team can use every month without cleanup work piling up.
That’s the core idea behind this guide: set up a chart that stays clean as the business grows, instead of rebuilding it under pressure later.
Build your CoA around the monthly reports you close from $500K to $10M: gross margin, cash burn, expense efficiency, and revenue by stream. The setup should answer those questions right away, without a bunch of manual cleanup at month-end.
Use a steady account order so reports stay clean and easy to read. A common setup is:
That order helps transactions flow into reports the way you expect. It also works best when you’re clear about where each layer of detail should live.
Don’t mix direct costs into operating expenses. Once that happens, gross margin starts to lose meaning.
For SaaS, implementation labor, contractor fulfillment costs, and customer hosting usually sit in COGS. That separation makes it much easier to compare product economics across lines of business, catch pricing problems early, and give investors the gross margin view they expect.
A lean CoA usually has 35–60 accounts, with 5–15 per major category. [3] When founders want more detail by department, location, or project, the first move is often to add more accounts. That’s where things get messy. The chart gets bloated, the close takes longer, and coding tends to drift from person to person.
Use departments, classes, or projects for detail instead of adding more GL accounts. In plain English: let dimensions do the heavy lifting without slowing down the close.
Each account should map cleanly to a line on the income statement, balance sheet, or cash flow view. If an account doesn’t map to a report line, cut it.
That link makes budget-vs.-actual reporting, board decks, and KPI dashboards much easier to produce each month. You’re not rebuilding the data every time. Investors and lenders also want to see revenue by stream, gross margin, and burn as clean line items.
Once the structure is lean and ready for reporting, assign numbers that leave room to grow without forcing a rebuild.
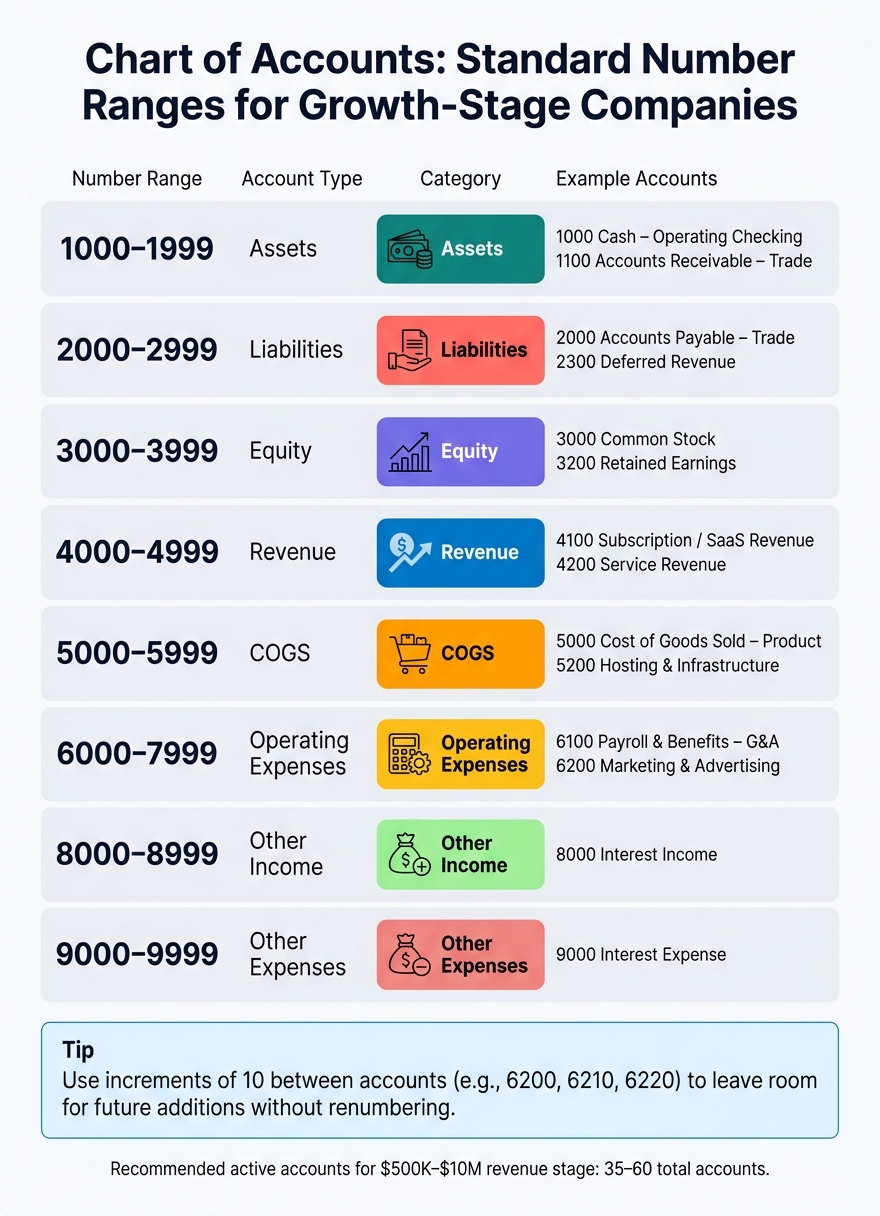
Chart of Accounts Number Ranges for Growth-Stage Companies
Once the structure is in place, the numbering system should make the CoA easy to code, review, and expand. The point is simple: the account code itself should help people spot the account type fast and keep the chart lined up with the financial statements.
Most growth-stage companies can work well with a 4-digit CoA. Move to 5 digits only if entity count or reporting detail calls for it. [6][1][9]
A common starting setup looks like this. [13][14]
| Range | Account Type | Example Accounts |
|---|---|---|
| 1000–1999 | Assets | 1000 Cash – Operating Checking, 1100 Accounts Receivable – Trade |
| 2000–2999 | Liabilities | 2000 Accounts Payable – Trade, 2300 Deferred Revenue |
| 3000–3999 | Equity | 3000 Common Stock, 3200 Retained Earnings |
| 4000–4999 | Revenue | 4100 Subscription / SaaS Revenue, 4200 Service Revenue |
| 5000–5999 | COGS | 5000 Cost of Goods Sold – Product, 5200 Hosting & Infrastructure |
| 6000–7999 | Operating Expenses | 6100 Payroll & Benefits – G&A, 6200 Marketing & Advertising |
| 8000–8999 | Other Income | 8000 Interest Income |
| 9000–9999 | Other Expenses | 9000 Interest Expense |
This kind of setup makes the chart easier to scan. If someone sees an account in the 6000s, they should know right away it sits in operating expenses. That saves time during coding and review.
Use increments of 10 so new accounts can slot in without renumbering everything. For example, use 6200 Marketing – General, 6210 Marketing – Paid Ads, and 6220 Marketing – Events. Later, 6230 Marketing – Sponsorships can be added without throwing off the rest of the chart. [7][10][4]
That little bit of space matters more than it seems. Without it, the chart can get messy fast, especially once new products, channels, or reporting needs start piling up.
Keep sub-account depth to one or two levels at most: a parent account and one or two child layers. Go deeper than that, and coding tends to get sloppy while reports get harder to scan. If you need more detail, use classes or departments instead of stacking on another account layer. [8][11][12]
A 2–3 page CoA policy helps keep coding decisions steady as the company grows from $500K to A 2–3 page CoA policy helps keep coding decisions steady as the company grows from $500K to $10M.0M, a process often managed through fractional CFO services. It should spell out the standard ranges, spacing rules, and naming conventions, such as Marketing – Paid Ads instead of Facebook Ads. It should also include a reserved ranges table with blocks left open for later use, like 4700–4799 for a future geographic revenue category, plus a simple change log for new, merged, or retired accounts. Define a clear approval workflow too: who can request a new account, who approves it - often the Controller or fractional CFO - and where the change is logged with its effective date. [5][10]
A short policy like this keeps the team from making up rules on the fly. It sets the ground rules for posting, approvals, and account requests across the team. Of course, a policy on paper is only half the job. The team has to use those rules the same way in day-to-day posting.
Once the numbering rules are in place, the next job is making the CoA work in the real world. That means daily posting has to be simple, and month-end close can't turn into a scavenger hunt.
As transaction volume grows from $500,000 to $10 million in revenue, coding mistakes and close delays tend to stack up fast. The fix is simple in theory: turn CoA rules into clear posting, review, and close procedures that the team can follow every day.
Start with the workflows that create most of the activity: sales, purchasing, payroll, and banking. Then trace each one from the source system - like your CRM, payroll platform, or POS - into the general ledger.
This step keeps the chart grounded in actual work instead of theory. If a workflow needs its own visibility, give it the right accounts. For example, you may need separate revenue accounts for subscription revenue and implementation fees. The same goes for cost of goods sold: hosting and support labor often belong in separate COGS accounts if you want clean reporting later.
Before you lock anything in, run a test month through the system. Then check whether the financial statements line up with the kind of reporting you'd feel fine putting in front of the board. A good stress test is this: if a normal transaction still makes someone stop and ask finance where it should go, the structure isn't ready.
A plain-English account name solves more problems than most teams expect. Merchant Fees – Stripe is much clearer than General Bank Fees. Hosting & Product Infrastructure tells a bookkeeper far more than Internal Software & Tools. The name should point the person to the right choice without guesswork.
Then support those names with a short account dictionary. A shared file in Google Docs or Notion works fine. Keep it simple: list each active account, give it a one-sentence description, add two or three common examples, and note the mistakes people make most often.
Some transaction types trip up growth-stage teams again and again, so they need direct rules:
| Transaction Type | Common Mistake | Correct Posting Rule |
|---|---|---|
| Customer refunds | Netting against current-month revenue | Post to a Contra Revenue account, such as 4100 – Refunds and Discounts, to preserve gross vs. net visibility |
| Prepaid expenses | Expensing the full payment in month one | Book to Prepaid Expenses as an asset and amortize monthly, for example $24,000 / 12 = $2,000 per month |
| Merchant fees | Burying in generic bank charges | Use dedicated accounts such as 1150 – Merchant Clearing – Stripe and 6250 – Merchant Fees – Stripe |
| Payroll accruals | Booking only when cash leaves the bank | Accrue gross pay and taxes at month-end using Accrued Payroll and Accrued Payroll Taxes liability accounts |
| Software costs | Mixing product infrastructure with internal tools | Separate Hosting & Product Infrastructure (COGS) from Internal Software & Tools (OpEx) |
For new team members, have the bookkeeper or controller review their coding for the first 60 to 90 days. Catch mistakes as they happen, not three weeks later during close. That kind of feedback loop helps people learn the system fast and keeps small errors from becoming monthly cleanup work.
Once posting is steady, add the control accounts that keep higher-volume activity in order. Accounts Receivable and Accounts Payable should be there from day one. Set up your AR and AP modules so every invoice, credit memo, vendor bill, and vendor credit runs through those accounts.
At month-end, the AR aging report should tie exactly to the A/R control account. The AP aging report should match A/P as well. When there's a gap, the cause is often a manual journal entry that skipped the subledger. That's why direct manual entries to these accounts should be limited to the controller or fractional CFO.
Clearing accounts are different. Don't add them just because they sound neat. Add them when volume or complexity creates a real reconciliation issue.
A merchant clearing account helps bridge gross sales, processor fees, chargebacks, and net deposits. Reconcile it every close. A payroll clearing account becomes useful once payroll includes multiple moving parts. In that setup, post the full payroll journal to clearing, then match the actual bank debits from your payroll provider to that balance.
The rule for any clearing account is straightforward: reconcile it every close cycle, and make sure the balance returns to zero or to a known amount you can explain.
Once the chart looks good on paper, the next test is simple: can your team still use it cleanly every day?
That’s where a lot of companies run into trouble.
The biggest issue is usually account sprawl. A founder adds one account for each vendor, each initiative, or each product line. Bit by bit, the chart gets bloated. Then the close takes longer, coding gets messy, and the data starts to feel noisy instead of helpful.
For a business doing between $500,000 and $10,000,000 in revenue, about 35–60 active accounts is a solid working range. [2][18]
Vague labels also cause problems fast. Accounts like Miscellaneous Expense, Other, and General Expense tend to become dumping grounds. Once that happens, it gets much harder to see where money is going, and gross margin and operating expense analysis become less dependable.
Two setup mistakes can quietly warp the numbers more than most teams expect:
When both parent and child accounts take entries, double-counting and month-end reconciliation issues tend to follow. If your system supports it, mark parent accounts as summary-only so transactions can post only to child accounts. [17]
Once the chart is lean, the next job is keeping it that way.
Before adding a new account, run a fast materiality check. Ask:
If the answer is no, don’t open a new account. Track it with a dimension instead - such as class, department, or project - inside an existing account. [16]
Review the chart quarterly when transaction volume is climbing fast. Later, once monthly volume and reporting needs settle down, move to a semi-annual review. The best time to do this is right after the month-end close and after board or investor reporting is finished.
The controller or fractional CFO should own this process. The bookkeeping team can flag problem accounts, and FP&A can weigh in on reporting impact. If you retire an account, mark it inactive so the historical data stays intact. [15]
The goal is pretty simple: build the chart for reporting, keep it lean, use dimensions for detail, and make each active account justify its spot.
That’s what keeps a CoA useful from $500,000 to $10,000,000 in revenue. It gives you a setup that can support monthly close, board reporting, and due diligence without forcing a rebuild every time the company grows.
This usually happens when simple category tracking stops giving you useful answers. For many businesses, that point shows up as they grow from $2M to $10M in revenue and add more product lines, sales channels, payroll complexity, or department-level cost tracking.
Before you add more accounts, pause and look at the bigger picture. You may not need a longer general ledger at all. In many cases, a better setup is to use dimensions like department, region, or product line instead of creating a separate general ledger account for every small subcategory.
Use accounts for the main financial categories that show up on your financial statements, like assets, liabilities, equity, revenue, and expenses.
Use dimensions to break those accounts down by a given lens, such as department, cost center, product line, region, or customer segment. That way, your chart of accounts stays clean, and you still get the reporting detail you need.
Start with clean, core financial reporting before you pile on extra layers. Your chart of accounts should first support monthly profit and loss statements, cash flow projections, budget-versus-actual comparisons, and real-time cash visibility.
From there, it also needs to support key operating views like revenue by product or service, gross margin analysis, and customer acquisition costs. Those reports give you a clear view of what’s happening in the business, which makes day-to-day decisions easier and helps you stay ready for investor scrutiny.