Published on
September 25, 2026


If I had to sum this up in one line: FP&A risk management means turning business risk into numbers, limits, and actions before cash gets tight.
For a growth-stage company doing $500,000 to $10 million in annual revenue, I’d keep the focus on five things:
A few numbers show why this matters. Cash-flow comfort among small businesses fell from 72% in Q4 2024 to 63% in Q1 2025. And in early 2025, 58% of U.S. small businesses named inflation as a top concern, while 35% pointed to revenue swings.
What I take from this is simple: a budget alone is not enough. I need a driver-based forecast, a 13-week cash view, downside cases for revenue and margin, and hiring gates tied to cash runway, not just growth targets.
Here’s the short version of the framework:
One point stands out: risk appetite is the level of uncertainty leadership will accept, while risk tolerance is the hard limit in the model, such as minimum cash, gross margin floors, or reforecast triggers.
I’d read the rest of this guide—or consult with a fractional CFO—as a plan for turning risk from a vague concern into a working part of budgeting, hiring, and cash control.
Once your main risks are on the table, put them into the budget model. For a growth-stage company, a static annual budget usually falls apart fast. What you need is a driver-based model.
That means building revenue, expense, and cash forecasts from the operating inputs that move the business: leads, conversion, ASP, churn, hiring dates, and fulfillment cost. When management updates one of those assumptions, the model should immediately show the impact on the income statement, balance sheet, and cash forecast.
Start by sorting assumptions into three buckets.
This matters because it shows how much of the budget can actually move in a downturn. If monthly operating expenses are $500,000 and $350,000 of that is committed, the model should make it plain which costs can change and by how much.
That cost structure shapes where a downside case can cut in practice.
Before you build scenarios, test one driver at a time. This helps you see which assumptions carry the most weight.
Here’s how driver changes affect cash and revenue for a company with $500,000 in monthly revenue:
| Driver tested | Change | Illustrative effect |
|---|---|---|
| Conversion rate | 6.0% → 5.0% | $25,000 lower monthly revenue |
| Churn | 3.0% → 4.5% | $100,000 lower quarterly recurring revenue |
| Payroll growth | 8% above plan | $100,000 higher annual operating expense |
| Collection timing | 30 → 60 days | $500,000 temporary cash gap |
| Average selling price | 5% below plan | Lower revenue and compressed gross profit |
Once you know which drivers hit hardest, and which ones put runway at risk, you can build scenario cases from combinations that could happen at the same time.
A demand-downside case might combine lower lead volume, weaker conversion, higher churn, slower collections, and a hiring pause. A cost-pressure case might keep revenue flat while adding wage increases, vendor price hikes, and higher freight. Each case should flow through the income statement, balance sheet, and cash forecast.[1][2]
If a downside case cuts revenue but leaves commissions, shipping, and collections untouched, it’s missing part of the picture.
The biggest exposures should then turn into reserves with clear triggers. Don’t set reserves as a flat percentage just because it feels neat. Set them based on the exposure you’ve already identified.
Separate reserves by purpose. For example, $25,000 might cover surprise customer support and refund costs. $100,000 might protect against a delayed collection or renewal shortfall. And a $500,000 liquidity reserve might cover the risk of a large enterprise customer paying 60 days late.
That last item goes beyond a budget reserve. It may call for a minimum cash balance, a revolver, tighter credit controls, or delayed discretionary investments.[3]
Each reserve also needs a trigger: a measurable condition that tells the team when to act. The table below links each exposure to an owner and a pre-agreed response:
| Risk | Likelihood | Dollar exposure | Timing | Owner | Mitigation | Trigger |
|---|---|---|---|---|---|---|
| Demand shortfall | Medium | $100,000 quarterly revenue gap | Next 3 months | Head of Sales | Reallocate qualified leads and pause low-return campaigns | Bookings below plan for 2 months |
| Gross-margin compression | Medium | $25,000 monthly gross-profit loss | Immediate | COO | Renegotiate vendors and review pricing | Margin under target by more than 3 percentage points |
| Delayed enterprise collection | Low to medium | $500,000 cash gap | 30–60 days | CFO | Escalate collections and draw approved liquidity facility | Receivable exceeds 60 days |
| Unplanned hiring | Medium | $100,000 annual payroll increase | Next 6 months | CEO and department leader | Require executive approval and milestone gate | Hiring causes runway below 6 months |
| Paid-media underperformance | Medium | $25,000 wasted spend | Monthly | Marketing leader | Shift spend to channels meeting CAC threshold | CAC exceeds target for 2 months |
A trigger without an action is just a metric. Every row needs a named owner and a response the team has already agreed to.
Next, apply the same logic to hiring and liquidity, or consider how fractional CFO services can help manage these complex risk models.
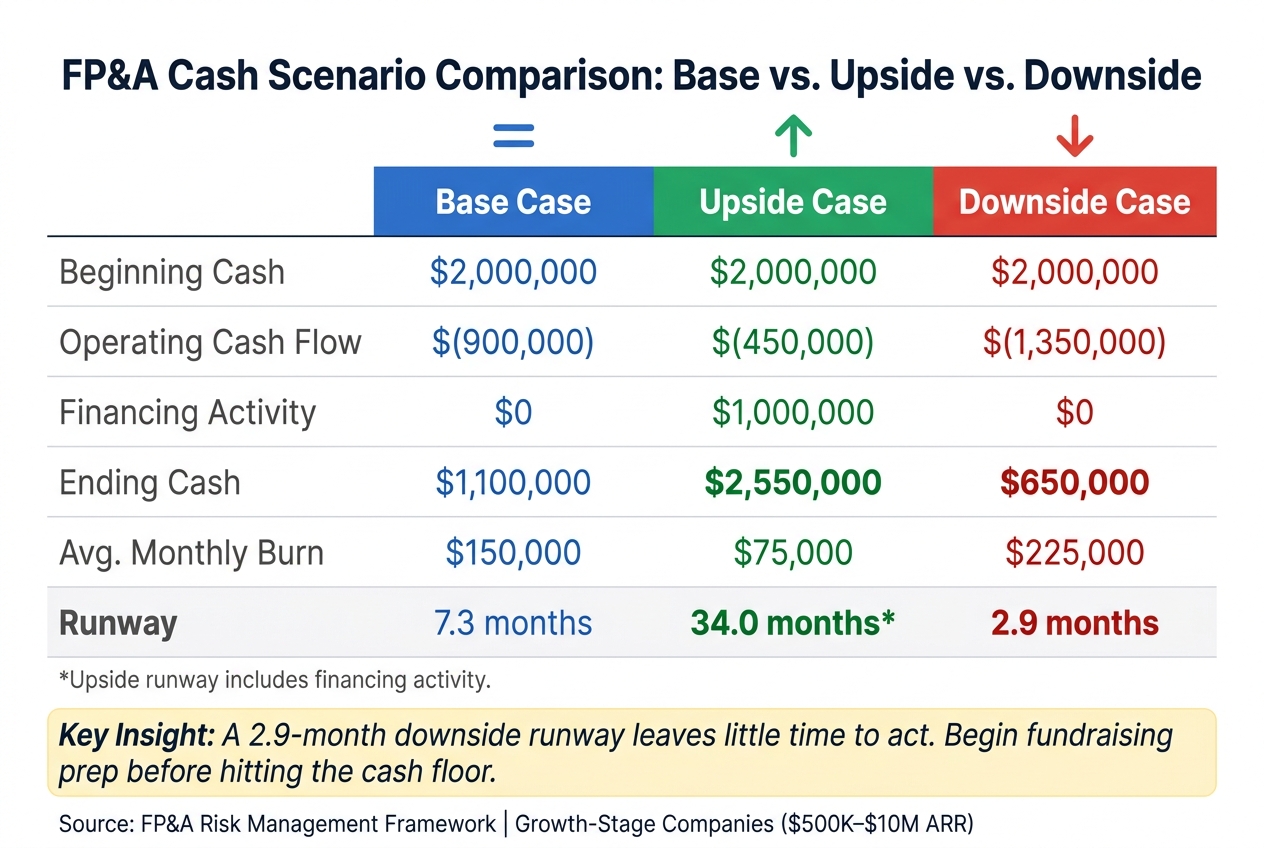
FP&A Risk Management: Base vs. Upside vs. Downside Cash Scenarios
Payroll often eats up 50%–55% of monthly cash outflow, which means hiring affects runway just as much as it affects operations. That’s why FP&A needs to model headcount and cash in the same schedule. A new role isn’t just a staffing choice. It’s a cash commitment.
Growth hires should stay conditional until the business clears clear revenue, margin, and runway gates. And the downside case needs to answer a simple question: if things slow down, do those hires still fit the cash plan?
Model each role from start date through payback: salary, taxes, benefits, recruiting cost, sign-on bonus, ramp time, and expected collections.[9][11] The point is to show when cash goes out and when that role is likely to earn back its full cost. Salary alone doesn’t tell you much.
Your model should also separate cash cost from accounting expense. That matters because a role may look fine in the budget while still putting pressure on near-term liquidity.
It helps to split roles into two groups:
For each role, the decision should be explicit: must-fill, delayed, contractor, or canceled.[4]
A hiring gate is a measurable condition that must be true before a growth-dependent role gets approved. Good gates are concrete, not fuzzy.
Common examples include qualified pipeline coverage above a set multiple of next-quarter quota, revenue at or above plan for two or more straight months, gross margin at or above the level needed to support more capacity, billable utilization reaching 75%–80% for the current team, and a minimum post-hire runway of 9 or 12 months.[8][9]
Each gate should spell out:
If a gate fails, don’t wait for the next planning cycle. Update the cash forecast right away so the hire date and runway reflect the new reality.
Use a 13-week direct cash forecast for near-term liquidity and a 12- to 24-month indirect forecast for runway and financing needs.[5][6] The long-range model shows how much runway the business has at a strategic level. The direct model shows whether the company can actually meet weekly obligations. You need both.
The headcount plan should connect straight into the cash forecast. If a hire start date moves, burn and runway should change automatically. No manual patchwork.
The downside case should also stack the risks together: slower bookings, delayed collections, lower gross margin, higher vendor costs, and no new financing.[7] That creates a tougher liquidity test, but it’s the one that tells you what happens when things go sideways all at once.
| Metric | Base case | Upside case | Downside case |
|---|---|---|---|
| Beginning cash | $2,000,000 | $2,000,000 | $2,000,000 |
| Operating cash flow | $(900,000) | $(450,000) | $(1,350,000) |
| Financing activity | $0 | $1,000,000 | $0 |
| Ending cash | $1,100,000 | $2,550,000 | $650,000 |
| Average monthly burn | $150,000 | $75,000 | $225,000 |
| Runway | 7.3 months | 34.0 months, including financing | 2.9 months |
A single runway figure can make things look calmer than they are. This table shows what actually moves the financing deadline and how much time management has to respond.[7]
A company that begins fundraising only shortly before its projected cash-out date may already be unable to negotiate from a position of strength.[10]
In steady conditions, review these outputs monthly. When runway gets tight, switch to weekly reviews. Those outputs then feed the monthly risk review.
Once the downside cash case is built, governance answers a simple question: who does what when the numbers move? Risk management only matters if it changes decisions. A risk register is just paperwork on its own. Governance needs a repeatable system with clear owners, pre-approved responses, and a decision point at every review.
Keep ownership clear: FP&A owns the model; department leaders own assumptions; executives own decisions.
FP&A keeps the model current and tied back to the books. That includes version control, scenario logic, one assumptions log, and reconciliation to accounting data. Department leaders own the operating inputs. The sales leader owns pipeline conversion and bookings. The operations leader owns vendor costs and capacity. The people leader owns hiring dates, compensation, and benefits. Executives set risk appetite, approve major tradeoffs, and authorize contingency actions.[12][14]
The assumptions log is what keeps the whole system from drifting out of sync. It feeds the budget, rolling forecast, headcount plan, and cash model. Each entry should include:
When an assumption changes, log the old value, new value, reason, approver, and model version. That avoids a common mess: the budget running on one hiring plan while the cash forecast quietly runs on another.[17]
After ownership is set, lock in a review rhythm. A monthly review works because it gives the team enough time to spot a shift without waiting too long to act.
Start with actuals against the approved budget and latest forecast across revenue, gross margin, operating expenses, headcount, cash balance, and runway. Then classify each variance as volume, price, timing, mix, or one-time. That step matters more than it may seem. A timing issue may only need a forecast note. A structural shift, like a sustained drop in conversion rate, should change the driver itself and flow through every linked model.
After the variance bridge, review all open mitigation actions: owner, expected dollar impact, due date, and current status. Then confirm whether any trigger threshold has been crossed and whether management action is now required.[16] If a material driver moves, reforecast right away. If it is only isolated timing noise, a note is enough.
Predefined triggers make action faster. When conditions get worse, the team should not be debating the playbook in real time. They should be running a response that was already approved.
Use the review to trigger action, not just report variance. The table below turns scenario outputs into management moves. Each trigger needs a threshold, a primary owner, an approval level, and a defined response. It should also state what has to happen before the action is reversed. For example, paused hiring resumes only after bookings recover above the approved threshold for two straight months and the downside cash case still clears the runway guardrail.[12][13]
| Trigger | Pre-agreed response | Primary owner |
|---|---|---|
| Bookings below downside case for 2 months | Pause noncritical hiring, revise sales capacity, and refresh the revenue scenario | CEO and sales leader |
| Gross margin 3 points below target | Review pricing, discounting, product mix, and vendor costs | CFO or finance lead and operations leader |
| Discretionary spend exceeds plan by 10% | Freeze nonessential travel, software, recruiting, and contractors | Department leader and finance lead |
| Accounts receivable aging worsens sharply | Accelerate collections, revise payment terms, and prioritize high-value accounts | Finance lead and sales leader |
| Runway approaches the minimum approved threshold | Reduce burn, renegotiate vendor terms, and begin financing discussions | CEO, board, and finance lead |
| Headcount plan exceeds revenue or margin gates | Delay start dates, replace some hires with contractors or automation, or require executive approval for exceptions | Department leader; HR; executive team |
Document each mitigation with its owner, dollar impact, due date, and completion evidence.[14][15]
The examples below show how the framework changes day-to-day choices when demand moves or costs climb.
Take a software company with $10 million in ARR, a $900,000 cash balance, and a plan to hire six account executives over two quarters. Now say bookings slow and growth drops from 40% to 20%. At that point, FP&A shouldn’t just trim the revenue forecast and move on. It should turn that signal into action.
Here’s what happens next:
That’s the shift. The team isn’t just watching the numbers fall. It’s making choices while there’s still time to steer.
The same approach works when the issue is cost pressure instead of softer demand.
Say a commerce company sees freight, cloud, and labor costs push gross margin down from 55% to 48%. FP&A should break out the impact by cost driver instead of applying a blanket cut across the model.
Stress-test gross margin at 55%, 52%, and 48%, then show what each case does to gross profit, burn, and runway. From there, use those margin bands to decide which hires, vendor costs, and pricing moves to pause, renegotiate, reprice, or delay.
Assign direct owners to freight consolidation, cloud optimization, vendor renegotiation, and targeted price increases. For each one, spell out the dollar impact, timing, and confidence level. If cloud costs go up 10%, for example, usage optimization may offset part of that increase. But the model should show when those savings might land and how certain they are, instead of pretending they happen right away.[18]
In both cases, the model turns risk into a decision, not a debate.
FP&A risk management works when it changes what the company does. Tie assumptions to triggers. Link headcount and cash to runway. Update scenarios as leading indicators change.
When risk is built into the model, the company can act before the P&L catches up.
Set clear, measurable guardrails instead of fuzzy phrases like “moderate risk appetite.” For example, you might require a six-month cash runway, cap monthly cash burn at $250,000, or keep your debt-to-equity ratio below 1.5x.
Then connect each threshold to a specific move. If revenue lands 20% below plan for two straight months, decide in advance which expenses get cut. Use tiered alerts, and make sure each one has a clear owner: one person for the data, and one person for the response.
Prioritize the risks that put liquidity and near-term survival on the line.
For growth-stage companies, start with three key risk indicators:
Then narrow your attention to 3 to 5 high-impact drivers that shape cash runway. Common examples include burn rate, revenue growth, and customer acquisition costs.
Tie those drivers to a 13-week cash forecast so you can see where pressure is building before it turns into a cash crunch. From there, rank each risk by likelihood and impact. That keeps the team focused on the issues most likely to drain cash or shorten runway.
Switch to weekly cash reviews when conditions get shaky or you need a closer read on liquidity to make faster calls. For growth-stage companies, this makes it easier to track cash runway, burn rate, and any gaps that may be coming.
A weekly cadence makes sense when you start seeing fast-moving signals, such as:
If the pressure gets more intense, review cash twice a week.