Published on
September 3, 2026

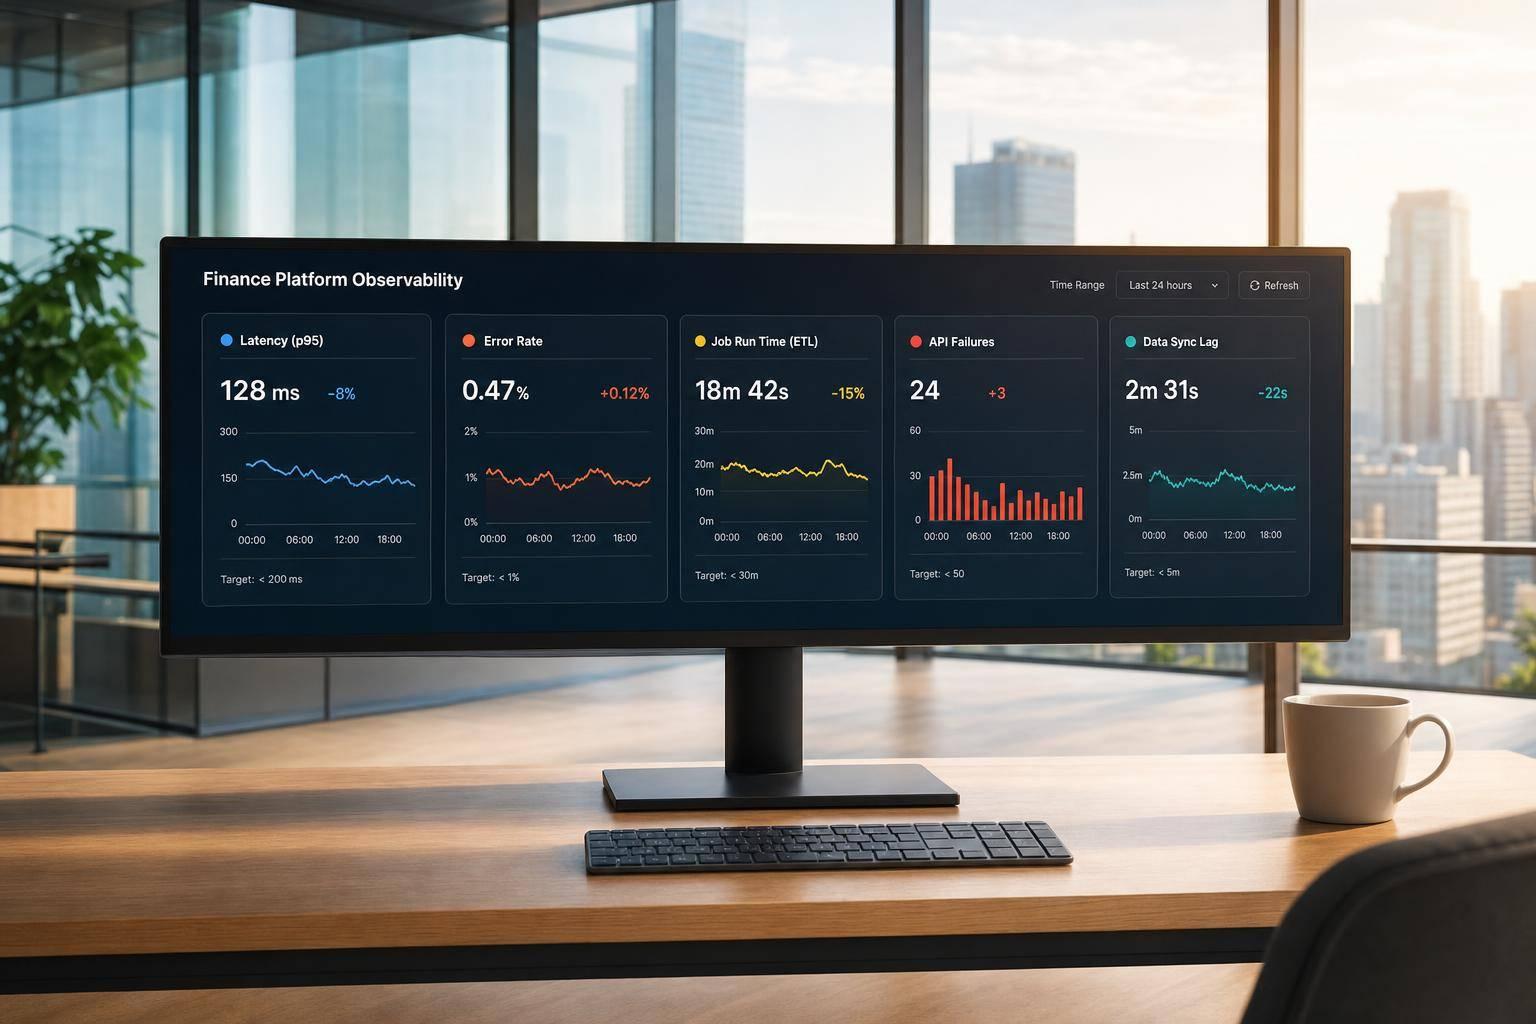
If I had to watch only five signals in a finance platform, I’d watch these: latency, error rate, job run time, API failure rate, and data sync lag.
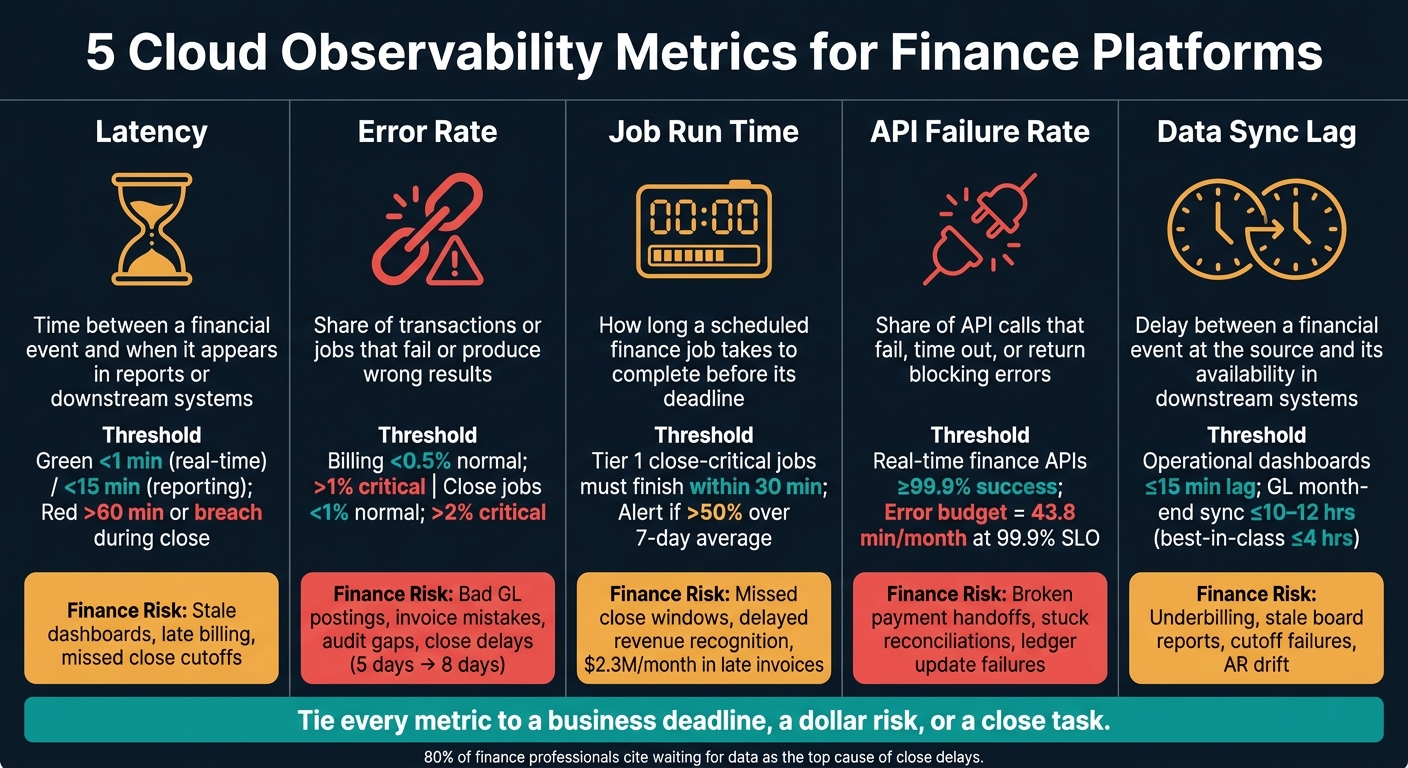
Why? Because these five metrics tell me, in plain terms, whether invoices will go out, reports will match, and month-end close will stay on schedule. When volume grows, even a small miss can turn into stale dashboards, failed postings, and late reconciliations. The article makes that clear with examples like 1% invoice errors across 100,000 invoices, 43.8 minutes of monthly error budget at 99.9% uptime, and close timelines slipping from 5 days to 8 days.
Here’s the short version:
What I like here is the business framing: don’t just track system health. Track whether billing, reporting, and close are at risk.
Quick Comparison
| Metric | What it tells me | Main finance risk |
|---|---|---|
| Latency | How delayed a workflow or report is | Stale dashboards, late billing |
| Error rate | How much work is failing | Bad postings, invoice mistakes, audit gaps |
| Job run time | Whether scheduled work will finish on time | Missed close windows, delayed revenue work |
| API failure rate | Whether connected systems are failing | Broken payment, ledger, or bank-feed handoffs |
| Data sync lag | How far downstream data trails the source | Old reports, cutoff problems, underbilling |
If I’m leading finance or engineering, this is the core idea I’d take away: tie every metric to a business deadline, a dollar risk, or a close task. That’s what turns observability from a system view into a finance control.
5 Cloud Observability Metrics Every Finance Platform Must Track
As finance platforms scale, small delays don’t stay small for long. They spread across billing, reconciliation, and reporting.
And as platforms grow, complexity climbs fast. More integrations - payment processors, ERP systems, banking APIs, tax engines, and data warehouses - create more places for things to break. A slowdown in one upstream system can ripple through the stack, leading to delayed postings and stale reports. Server uptime by itself won’t catch that kind of problem. These failures often stay hidden until they show up as reporting delays, billing mistakes, or close slippage.
The same issue shows up in data work. When ETL jobs fail silently or run late, dashboards can look fine on the surface while showing stale data. Then forecasts pick up that bad input and carry the error forward.
Timing matters too. A 2-hour data sync lag might be tolerable in the middle of the month. Near month-end, though, that same lag can turn into a cutoff risk. If payment and tax integrations fail off and on, invoices may be generated with errors - or not generated at all - which can lead to revenue leakage. At scale, even a 1% invoicing error rate across 100,000 monthly invoices can mean hundreds of thousands of dollars in misbilled amounts.[2] That’s where observability helps: it turns hidden risk into signals teams can track and act on before close timelines or cash flow take a hit.
Growth-stage companies feel this pressure the most because their architecture and finance processes are often changing at the same time. New products, new integrations, and new reporting demands make it harder to keep data pipelines stable and finance outputs trustworthy. The five metrics below turn those risks into signals finance teams can monitor.
Latency is the gap between a financial event and the moment it appears in finance reports, dashboards, or downstream systems. In finance, even a short delay can make revenue, cash, and aging reports stale enough to throw off same-day calls. Usually, the problem hits reporting first, then spills into billing and close timing.
The clearest impact is report freshness. If a dashboard trails by 10–15 minutes during heavy transaction volume, sales and finance may end up staring at different current-day revenue totals. For finance leaders, that has an immediate effect: the AR aging report is behind, and recent payments might still be missing before the 9:00 a.m. collections call.
The same delay causes a different kind of problem when it affects billing feeds. In usage-based or subscription models, a late usage feed can push charges into the wrong billing window, spark customer disputes, or create revenue recognition timing issues that need manual fixes. It helps to separate report lag from processing lag. A report may look up to date while billing is still chewing through queued events.
Latency tends to hurt most at month-end close. A billing or ERP sync that usually trails by 30 minutes but sometimes stretches to 2 hours on the last business day can leave accountants with a bad choice: close on partial data or wait and slip the schedule. The core issue isn’t just delay. It’s incomplete close data at the exact moment the business needs certainty.
Use three bands:
| Band | Latency Range | Typical finance use |
|---|---|---|
| Green | < 1 min for real-time workflows / < 15 min for reporting dashboards | Payment posting, AR aging dashboard |
| 🟡 Yellow | 15–60 min | Daily revenue reports, ETL pipeline delays |
| 🔴 Red | > 60 min or breach during close | Month-end cutoff, billing batch overrun |
Alerts should fire on sustained breaches, not brief spikes. That cuts noise during known volume bursts. It also helps to track latency by business process, not just infrastructure, so finance can see which report is stale and which deadline is at risk.
If latency tells you data is stale, error rate tells you the process may be starting to fail.
Error rate tells you how much work is failing or ending half-done inside a given time window. And at scale, even one broken feed can snowball fast. Dashboards go off, invoices get stuck, and close gets delayed all at once.
For reporting, the hit is immediate. If a nightly revenue consolidation job runs into a 5% error rate on a major payment processor feed, the FP&A dashboard may end up missing millions of dollars in transactions. That leaves finance leaders making decisions from understated performance numbers.
Billing is even harsher. Failed invoices, misapplied payments, and rejected tax calculations don’t just create noise. They lead to disputes, reissues, and revenue leakage.
Month-end close is where this turns into a time problem. After a pricing change, a 3% to 4% error rate can leave hundreds of contracts unreconciled and stretch close from 5 days to 8. That delay can hold up board reporting and covenant checks.
Use workflow-specific thresholds:
| Workflow | Normal | Warning | Critical |
|---|---|---|---|
| Reporting pipelines | < 1% | 1–3% | > 3% |
| Billing processes | < 0.5% | 0.5–1% | > 1% |
| Close jobs (recon, posting, consolidation) | < 1% | 1–2% | > 2% |
One more thing: alert on the dollar amount at risk, not just the percentage. A small error rate can still mean a big financial hit if the jobs touch high-value transactions.
If error rate tells you whether work is failing, job run time tells you whether it can still finish on schedule.
If error rate tells you whether work breaks, job run time tells you whether it finishes before the cutoff. Put simply, job run time is how long a scheduled finance job takes to complete before its deadline.
This matters because finance reporting depends on jobs landing on time. Many teams need prior-day data ready by 8:00 a.m. ET. If a daily ETL job that loads card transactions runs late, morning FP&A dashboards miss the window. Then a report that should be ready before markets open at 9:30 a.m. ET gets built on incomplete data.
Billing has the same kind of timing pressure. In usage-based billing, slow rating or aggregation jobs can miss the invoicing window and push cash collection back. Versapay cited research showing that mid- to upper-midsized companies fail to collect roughly $2.3 million in expected payments each month, partly because invoices go out late.[5]
Month-end close is where run time stops being a warning sign and becomes a hard deadline. If close-critical jobs slip, the close slips too. Many U.S. companies aim for a 5-business-day close, so a run time spike on day 2 or 3 can snowball into a missed day-5 target.
For engineering, track median run time and the slow end of the range. For finance, keep the view simple: on-time, delayed, or failed, tied directly to close readiness.
| Job Tier | Examples | Run Time SLA | Alert |
|---|---|---|---|
| Tier 1 – Close-critical | GL posting, consolidation, FX translation | Must finish within 30 minutes | > 50% over 7-day average |
| Tier 2 – Billing/operational | Invoice generation, payment reconciliation | Must complete before the billing window cutoff | Misses billing window cutoff |
| Tier 3 – Analytics | Weekly reporting, historical aggregations | Can tolerate longer run times | > 2× historical average |
If job run time shows whether work finishes on time, API failure rate shows whether the connections underneath it are holding up.
If job run time tells you whether a workflow finishes on time, API failure rate tells you whether the calls behind that workflow can be counted on.
API failure rate is the share of API calls that fail within a rolling window. That includes:
Not every failure has the same weight. A 3% failure rate on a low-stakes notification API might be fine. A 0.3% failure rate on a payments API or GL posting API is a different story. In finance, even a small miss rate can turn into repeated blockers across payments, posting, and reconciliation when volume climbs. If bank feed or payment processor APIs fail, transactions get stuck, reconciliation drags, and accountants may end up working from incomplete statements.[4]
Billing gets hit just as fast. Billing systems rely on usage, entitlement, discount, and pricing APIs. At billing scale, even a small failure rate can leave thousands of units unbilled or priced the wrong way.[10]
For targets, use ≥ 99.9% success for real-time finance APIs like payments and ledger postings, and ≥ 99.5–99.9% per batch for critical batch APIs. At a 99.9% SLO, the error budget is about 43.8 minutes per month.[9]
| API Type | Example Endpoints | Target Success Rate | Alert Trigger |
|---|---|---|---|
| Real-time financial | Payments, GL posting, bank feeds | ≥ 99.9% | Failure rate exceeds the SLO threshold over a 5-minute rolling window |
| Critical batch | Billing exports, FX rate pulls, close ETL | ≥ 99.5–99.9% per batch | Any sustained batch-window failure that blocks the job |
| Non-critical | Notifications, marketing integrations | ≥ 99.0–99.5% | Failure rate exceeds the agreed threshold over a 1-hour rolling window |
Here’s the practical split: engineering needs endpoint-level detail, while finance needs workflow and dollar impact. That’s why it helps to track both 5-minute and 1-hour windows. The short window catches spikes. The longer one catches slower, stubborn degradation.[10][8]
This metric only starts to matter when alerts tie back to workflow risk: which workflows are affected, the estimated dollar exposure, and whether the close is at risk.[9]
Data sync lag is the time between when a financial event happens at the source - like a card authorization, an invoice being issued, or a bank settlement posting - and when that same event is fully available in downstream systems such as the data warehouse, GL, billing engine, or dashboards.[7]
Put simply, this delay flows straight into reporting freshness, billing completeness, and the speed of month-end close. If lag builds up in one place, it tends to spread everywhere else.
You need to measure lag end to end: from source commit to destination availability.[7] Just knowing that ingestion succeeded doesn't tell you much. The real issue is whether the data showed up where Finance actually needs it. And in most cases, the slowest stage becomes the pace setter for freshness, so a “successful” pipeline can still leave you exposed.
For billing, lag tends to create underbilling, not overbilling. Why? Because if usage data lands after the invoice cut-off, that usage either gets pushed into the next billing cycle or has to be picked up through a manual catch-up invoice. A solid control here is a hard cut-off window. For example, all usage for the prior month must be processed by 3:00 a.m. PT on the 2nd, and billing should run only after data completeness is confirmed - not just because the clock says it's time.[7]
Month-end close is usually where lag does the most damage. If bank feeds show up 1–2 days late, cash and AR subledgers drift away from the GL. That often means either the close slips or teams spend extra time reconciling later.[6][1][11] Close calendars should treat bank feed completion and final GL sync as hard prerequisites, not side notes. Lag has to clear before close work starts. Finance leaders should view lag as a business clock, not just a pipeline metric.
Thresholds depend on the job the pipeline is doing:
Alerts should fire on two things:
That second signal matters because it catches slow decline before it turns into a clear outage.
One last point: show lag in minutes or hours behind, not row counts.
Once you’ve defined the five metrics, the next job is to put them into terms Finance can use. Keep each metric in three parts:
That means using business language, not system language. So instead of saying latency spiked, say invoice generation slowed during peak billing hours (4:00–6:00 p.m. ET), and about 1,200 invoices a day were delayed from being sent on time.[13] That shift is what turns a metric into something a CFO or controller can act on.
Here’s the plain-English version. Latency shows up as stale dashboards and slow invoice generation. Error rate shows up as bad postings and audit gaps. Job run time shows up as missed close windows. API failure rate shows up as broken handoffs between systems. Data sync lag shows up as stale reporting and late billing.
Start with the threshold, then tie it to business impact. For example, if a close-critical integration misses its SLA, expect unreconciled cash and manual catch-up work before the books can close. Use the table below as the standard executive framing.
| Metric | Finance-friendly definition | Business workflow at risk |
|---|---|---|
| Latency | How long the system takes to respond or process | Invoice generation, dashboard refresh, reporting speed |
| Error rate | % of transactions or jobs that fail or produce wrong results | GL accuracy, billing correctness, audit readiness |
| Job run time | How long scheduled finance jobs take to complete | Close timing, revenue recognition, cash application |
| API failure rate | How often system-to-system connections fail | Invoice sync, ledger updates, bank reconciliation |
| Data sync lag | Delay between a financial event and its arrival downstream | Cut-off accuracy, real-time reporting, billing completeness |
Use these definitions when setting alert thresholds and SLA targets.
Also, track percentiles, not just averages, for latency and job run time.[12][13] Averages can hide the moments that hurt the business most. A job might average 30 minutes but still run 3 hours now and then. That’s a close risk, and the average by itself won’t show it. Show the median along with P95 or the worst case so Finance can see where close risk starts to creep in.
This table pulls the five signals into one view for Finance and Engineering. Use it to tell the difference between a workflow that's just slow, an integration that's failing, and data that's old.
| Metric | Definition | Unit of Measurement | Primary Financial Risk | Most Affected Workflow |
|---|---|---|---|---|
| Latency | End-to-end time for a finance action to complete | Milliseconds (ms) or seconds (s); track P95/P99 | Delayed billing and cash operations; missed cutoffs | Billing (invoice generation, pricing updates, collections dashboards) |
| Error Rate | Share of finance transactions or requests that fail | Percentage (%); measured per workflow (posting, invoicing, payments) | Misstated financials, incorrect invoices or payouts, audit exposure | Close (journal postings, consolidations, reconciliations) |
| Job Run Time | Time for a scheduled finance job to complete | Seconds (s), minutes (min), or hours (h); track median and P95 | Missed processing windows; delayed revenue recognition and extended close timelines | Close (allocations, consolidations, subledger rollups) |
| API Failure Rate | Share of API calls that fail or time out | Percentage (%); measured per integration in 5–15 minute windows | Lost or delayed external transactions; weaker revenue capture and payment reliability | Billing (payments, external billing, bank feeds) |
| Data Sync Lag | Time between a source change and downstream availability | Minutes (min) or hours (h); track median and P95 per source system | Stale financial data driving inaccurate forecasts, dashboards, and board reporting | Reporting (dashboards, management reports, board packages) |
Error rate and job run time both hurt month-end close, but not in the same way. Error rate creates bad data. Job run time creates schedule pressure.
The same pattern shows up in billing. Latency slows people down while they work. API failure rate is a different problem entirely; it causes transactions to fail or time out.
Use this table as a fast triage tool, then turn these metrics into alerts, SLAs, and close-readiness rules.
Collecting the five metrics is only half the job. The next part is deciding what happens when one of them crosses a line. Start with the comparison table, then turn it into escalation rules. The aim isn't more noise. It's faster decisions on billing, reporting, and close. That means setting thresholds and writing SLAs in terms finance leaders use every day.
Use these baseline escalation levels:
Each threshold points to a clear business risk. A revenue recognition run may finish late. A payment may not post. A reconciliation may not start when it should.
SLAs should sound like finance commitments, not system notes. For example: GL posting jobs will complete within 30 minutes and finish by 2:00 a.m. ET during close periods, so reconciliations can start by 8:00 a.m. ET. Lago's billing-observability guidance recommends immediate escalation for an invoice generation job failure with a 15-minute response SLA, a payment-provider outage with a 5-minute SLA, and a same-day high-severity condition when payment success rate falls below 85%.[3] Those SLAs should roll up into one close-readiness dashboard.
For month-end close, build a dashboard that ties all five metrics to the close tasks that depend on them. If API failure rate or sync lag crosses a threshold, the dashboard should switch a reconciliation status from On Track to At Risk. That gives teams time to dig in early instead of rushing at the last minute.
Alert design matters too. A critical payment-posting error should page the on-call owner right away. A warning that latency is drifting toward its limit can wait for a morning summary. In plain English: the threshold matters, but routing matters just as much. Finance operations, engineering, and data teams each need a clear lane. Put that into a RACI matrix and an on-call schedule before the close window starts, not in the middle of it.
Teams using this kind of observability-led close process, backed by defined SLIs and SLOs, have seen measurable gains. One financial-systems study reported a 76% reduction in MTTR for critical incidents after moving to a cloud-native observability stack.[15] Review thresholds each month and tighten them as on-time close improves and post-close adjustments drop.
These five metrics - latency, error rate, job run time, API failure rate, and data sync lag - tell you a lot about the health of a finance platform.
And they map straight to what finance teams care about every day: whether invoices go out on time, whether the general ledger closes cleanly, and whether the numbers in a board package can be trusted.
The stakes are high. Nearly 80% of finance professionals blame close delays on waiting for data from other systems.[14] So watching these five metrics isn't just an engineering task. It's one of the clearest ways engineering and finance stay in sync when the pressure is on.
For U.S. GAAP finance platforms, these metrics act as a shared control layer across multi-entity billing, high-volume processing, and close. Phoenix Strategy Group uses this lens to help growth-stage companies scale, prepare for audits, and get ready for funding or exit.
Track these five metrics, and engineering becomes a direct input to finance speed, accuracy, and close readiness.
Start with p99 latency and 4xx/5xx error rates. These are the first signals to watch because they often show trouble before it turns into support tickets or lost revenue.
At the same time, keep a close eye on high-risk workflows like bank imports, revenue syncs, and billing data. With real-time dashboard visibility, teams can spot issues early instead of waiting for delayed month-end data.
Use a structured approach based on system criticality and past performance.
Start with a 3- to 6-month baseline to define what normal looks like. That gives you a solid reference point before you set thresholds.
For SOX-scoped systems, aim for 99.5% availability or higher. For operational applications, 95% to 98% may be enough.
You should also set Key Risk Indicator bands so teams can sort alerts by priority instead of treating every issue the same.
Then bring those thresholds to your risk committee for approval, and review them once a year as your scale and business goals shift.
Finance teams should review these metrics based on how fast a problem can turn into risk.
Metrics like latency, error rates, and API failures need daily or near-real-time tracking. That gives teams a chance to catch issues before they start hitting systems that support revenue.
For governance and compliance, these same metrics should also show up in weekly controls reviews and quarterly reporting. Instead of waiting for month-end reports, teams should rely on real-time dashboards and set regular quarterly check-ins.