Published on
July 22, 2026


If I want to know whether a compliance framework still fits the business, I look at just three things first: process, outcome, and timing metrics. That gives me a fast read on whether work is getting done, whether it is cutting risk, and how long it takes to find and fix problems.
Here’s the short version:
What matters most is not one metric by itself. I need to compare all three side by side.
I also need clean data. That means:
A simple annual scorecard should stay small and tied to decisions:
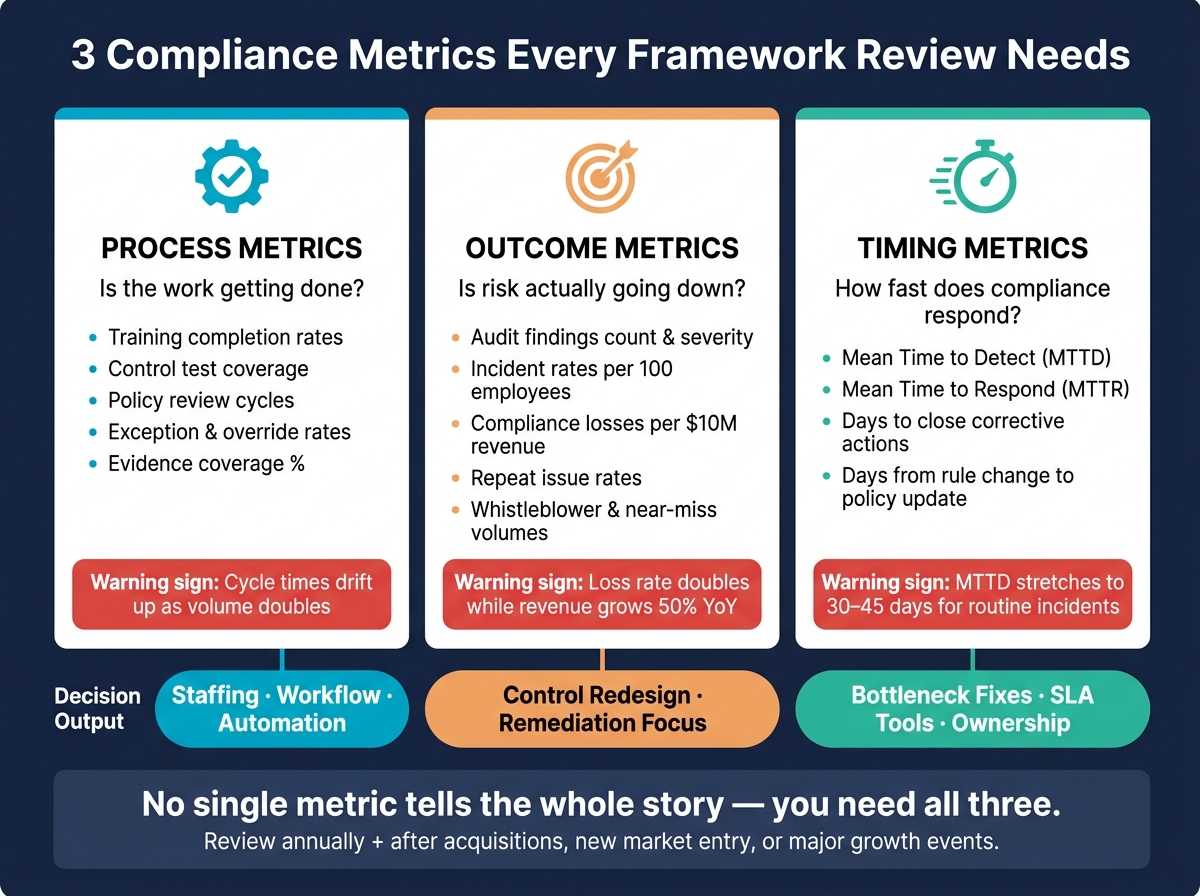
3 Compliance Metrics Every Framework Review Needs
| Metric type | What I learn | Common signals | What it usually leads to |
|---|---|---|---|
| Process | Whether work is being completed | missed tasks, low evidence coverage, more overrides | staffing, workflow changes, automation |
| Outcome | Whether risk is going down | more findings, repeat incidents, higher losses | control redesign, remediation focus |
| Timing | Whether response is fast enough | longer detection and closure times, policy lag | bottleneck fixes, SLA tools, ownership changes |
Bottom line: I would review these metrics at least once a year, and again after events like acquisitions, new market entry, or major growth. The goal is simple: keep the framework matched to the business as it changes.
Process metrics show how compliance work gets done. They tell you whether required tasks are finished on time and with the right level of coverage. As workload grows, the big test is simple: can the same process handle more work without starting to crack?
Process metrics are often most useful during a framework review because growth puts pressure on the system fast. As a company gets bigger, compliance work grows right along with it - reconciliations, vendor reviews, access approvals, and control tests all pile up.
That’s where the warning signs start to show. If average cycle times begin to drift upward while transaction volume only doubles, or training completion falls after a hiring push, the framework likely isn’t scaling well. Automated control coverage helps show how much extra workload the team can handle without adding headcount. A heavy manual share, on the other hand, is a red flag when data volume climbs fast. [3][5][6]
Once volume starts to strain the process, exceptions usually show up before losses do.
Process metrics work best as early warnings when they focus on exceptions and delays, not just raw activity counts. Exception and override rates - the percentage of transactions handled outside normal procedures - often start rising before control failures appear in outcome metrics. In the same way, pockets of late or skipped monitoring tasks can point to resource strain before an audit finding appears.
It also helps to track alert precision. If that rate is low, staff end up chasing noise. That leads to fatigue, and when people get worn down, real problems are easier to miss. [2][8]
When process metrics start moving in the wrong direction, they can help show whether the problem comes from staffing, workflow, or control design. That matters because each problem calls for a different fix - more hiring, better systems, or changes to the controls themselves.
For example, rising exception rates on low-risk approvals often suggest the process is too heavy for the company’s current size. Boards usually want these metrics broken out by business unit or risk category so they can spot where execution is starting to fail. [2][7][9]
Process metrics only help if the data behind them is sound. The main problem here is pretty common: controls get marked complete, but there’s no proof attached.
To keep the data honest, compliance teams should require mandatory fields in the system they use, including:
Teams should also check training records against HR data from time to time. Evidence coverage - the share of completed tasks backed by actual evidence - is a direct way to judge whether the data can be trusted. If evidence coverage is low, audit risk goes up even if the work happened. It also weakens the review itself, because every metric built on that data becomes harder to trust. [4][5]
Clean process data matters most when outcome metrics show whether those processes are reducing risk.
Process metrics show activity. Outcome metrics show results. They tell you whether that activity actually cut risk.
That includes end results like incident rates, audit findings, remediation results, and the dollar cost of compliance failures. For U.S. growth-stage companies, these numbers often matter most to boards and investors because they tie straight to risk, money, and regulatory standing.
To see whether a compliance framework can keep up with growth, normalize the data. Raw counts can mislead. A company that doubles in size may log more incidents even if performance stays flat.
A better approach is to track rates, such as incidents per 100 employees or per $10 million in revenue. If compliance losses as a share of revenue are doubling while the business is growing 50% year over year, the framework is not keeping pace. The same warning sign shows up when audit findings jump after the company enters new states, launches new products, or finishes an acquisition. [2][11]
When those normalized rates move in the wrong direction, the next step is to ask a simple question: is the framework finding issues soon enough?
Look at how issue severity changes over time and where issues are first found. More low- and medium-severity events often point to earlier detection. More issues found by regulators, customers, or auditors point to weaker internal detection.
Whistleblower reports and near-miss volumes help here too. They can act like an early warning light on a dashboard. If people are speaking up and small problems are being logged, the reporting culture may be surfacing risk before it turns into something larger. [10][12]
Outcome metrics shape capital planning and board decisions because they show whether losses, findings, and remediation costs are moving in the right direction.
If losses and findings rise faster than revenue or headcount, the framework is falling behind. Trend data matters a lot here. A lower repeat offense rate or a shorter average remediation time can support staying the course. On the other hand, high incident rates that stick around across several domains can support a broader overhaul.
For companies getting ready for fundraising or exit diligence, a clean audit history and a lower loss ratio can strengthen credibility. [10][2]
Outcome metrics are only useful if the data is sound. That means standardizing severity scoring, matching loss data with finance records, checking impact estimates, and comparing internal logs against whistleblower reports and external findings.
Audit trails and periodic data quality reviews help spot-check closed incidents and the impacts recorded for them. If there’s a large gap between what internal logs show and what auditors or regulators find, that gap is a warning sign on its own. [14]
Once outcome data is clean, timing metrics show how fast the framework responds.
Outcome metrics tell you what happened. Timing metrics tell you how fast compliance moved. They track how quickly issues are found, addressed, and closed.
Timing metrics are one of the clearest early signs that a compliance framework is starting to fall behind growth. If remediation time climbs faster than revenue or headcount, the system is under strain. That gap between expected response times and actual response times shows when the framework is no longer keeping up.
When timing starts to slip, MTTD and MTTR help show where the slowdown begins.
The two timing indicators that matter most for risk detection are Mean Time to Detect (MTTD) and Mean Time to Respond (MTTR). MTTD measures how long it takes to detect an incident after it happens. MTTR measures the time from detection to first response or full remediation, depending on how the metric is set up.[15][16]
If MTTD stretches out, say to 30 to 45 days for routine compliance incidents, that's usually a sign that monitoring controls, internal logging, or reporting channels aren't moving fast enough. Breaking these metrics out by severity, business unit, and risk category, like data privacy, financial reporting, or vendor risk, makes it much easier to see where the framework is lagging instead of trying to fix every problem at once.[17][20]
Those delays often point to the root cause. Sometimes it's a staffing issue. Sometimes it's workflow. Other times, the controls themselves need work.
Timing trends give leadership hard data they can use. If policy updates keep lagging behind regulatory changes by 90 days or more, that usually points to a gap in ownership or staffing. The trend line matters just as much as the raw number. A lower repeat offense rate or a shorter average remediation time can support staying the course, while delays that keep showing up across several domains can make the case for a broader overhaul.[18][19][21]
System-generated timestamps from ticketing and workflow tools are far more reliable than manual entries. The most common data issue is inconsistent definitions. One team may count "remediation start" from ticket creation, while another starts the clock when a fix is deployed. That's a recipe for messy reporting.
Use a metrics catalog to define each timestamp, then spot-check records across security logs, audit trackers, and case tools.[15][16][1]
Clean timing data should feed staffing, systems, and control decisions in the next review step.
Once a review shows where the gap sits, the fix usually lands in one of three areas: people, systems, or controls. And each metric category - execution, results, and speed - points to a different move.
Process metrics show whether the current team can keep up with the compliance work in front of them. If control volume is high and execution gaps keep showing up, that’s a clear sign to add compliance operations staff or place control owners inside the business.[23][24]
Outcome metrics show shortfalls in investigation and remediation capacity. If audit findings keep repeating, root cause closures drag on, or corrective actions stay open past agreed deadlines, it makes sense to add investigators or remediation specialists, such as forensic accountants or compliance project managers.[22][25]
Timing metrics point to bottlenecks in the way work moves. When delays pile up, the need is less about headcount in general and more about the right kind of help: a process analyst or workflow specialist who can clear bottlenecks and reset deadlines.[23][24][25]
Hiring by itself won’t fix much if the new team walks into the same messy process. Extra capacity needs better tools and clearer controls behind it.
If staff alone can’t close the gap, the next move is usually automation or case management. The metric type tells you which tool fits.
| Metric Category | Typical Systems Investment | Primary Purpose |
|---|---|---|
| Process Metrics | Workflow automation, LMS platforms with completion tracking | Reduce manual touchpoints, enforce standard procedures |
| Outcome Metrics | Case-management platforms, analytics and monitoring dashboards | Standardize incident intake, spot recurring issues |
| Timing Metrics | SLA-based escalation tools, orchestration platforms | Enforce response deadlines, manage handoffs across teams |
In practice, case-management tools make sense when findings keep coming back, while escalation tools help when work is sitting overdue.
When staffing and tools still don’t solve the problem, the review should push a control redesign.
Outcome metrics are what usually trigger control redesign. Repeated failures call for preventive checks. Issues found too late call for stronger detective monitoring. And recurring root causes call for playbooks that spell out what happens next.[22][25]
If outcome metrics show that problems surface only during audits or through customer complaints, detective monitoring needs to get tighter. That can mean exception reports, anomaly detection on transaction patterns, or scheduled reconciliations.[22][13][25] If the same root causes keep showing up, remediation should move away from one-off responses and into playbook-based workflows with set timelines and clear accountability.[22][13][25]
Timing metrics lead to a different kind of control change. When approval delays hold up revenue or create regulatory exposure, preventive controls should be redesigned around risk tiers. Low-risk transactions can move through with limited review, while high-risk activity gets the deeper scrutiny.[25]
The next step is to weigh which metric category gives the clearest signal in each review cycle.
Each metric category does one job well. And each one misses something. If you lean on just one, you only see part of the story.
| Metric Category | Main Advantages | Main Limitations | Best Use in Reviews |
|---|---|---|---|
| Process Metrics | Shows whether the framework is being carried out the way it was set up; helps spot gaps in ownership, documentation, and workflow early | Can push teams into box-checking; full training completion doesn't prove people understood the material or that the material still fits | Policy review completion, control test coverage, training completion, and test pass rates |
| Outcome Metrics | Shows whether controls are actually reducing risk; connects compliance performance to business results | Lagging indicators; can be skewed by outside shocks or short-term enforcement changes; may miss near-misses | Audit findings, incident rates, financial losses, and complaints tied to control failures |
| Timing Metrics | Shows responsiveness and agility; helps uncover bottlenecks before they turn into regulatory exposure | Can reward speed at the expense of substance; depend on accurate timestamps, which many mid-market companies don't track in a steady way | Detection time, remediation cycle, and days from a regulation change to a policy update |
Use the table above to build a short annual scorecard. Keep that scorecard fixed across all three metric types so year-over-year review stays clean and easy to compare.
On the process side, track policy review completion rates, control test coverage, and training completion and test pass rates. On the outcome side, review the number and severity of regulatory findings, recurrence rates for audit issues, and the financial impact from non-compliance events such as fines or settlements. On the timing side, look at median remediation time, days from a regulatory change to a policy update, and case cycle times from report to closure.
Then layer in event-specific metrics when the business takes on more compliance weight. After acquisitions, new market entries, or funding events, add measures for control integration, complaint spikes, and the speed of staffing and systems expansion.
The point is simple: test whether the framework still fits the company's current size and complexity. No single metric category can do that alone. You need process, outcome, and timing metrics together to judge fit, performance, and speed.
Keep the set small. Keep it balanced. And tie each metric to a clear decision about hiring, systems, or controls.
Prioritize metrics based on your risk exposure. Start with a risk assessment that ranks threats by likelihood and impact: critical, high, medium, or low.
Tackle high-likelihood, high-impact risks first. A good example is late tax filings. If that risk sits near the top of your list, it deserves attention before lower-stakes process issues.
Once those risk-heavy areas are under control, shift to efficiency metrics such as error rates, exception counts, and reconciliation timelines.
Normalize compliance metrics by shifting from manual tracking to automated, real-time data collection. Pair that with standardized data definitions across the organization so teams measure the same thing in the same way.
Set clear, time-bound KPIs that match your current business complexity. Focus on metrics like error rates, resolution speed, and audit finding closure. Review those KPIs on a regular cadence, and move reconciliation from monthly to weekly or even daily when needed. That makes it easier to spot patterns early and adjust thresholds before small issues turn into bigger ones.
Reliable metrics start with a centralized data strategy. The goal is simple: create a single source of truth by pulling data together from general ledgers, CRM tools, HR platforms, and payment processors.
That matters because scattered systems often tell slightly different stories. Finance may show one number, sales another, and HR something else entirely. A centralized setup cuts through that mess and gives teams one place to work from.
Reliability also depends on strong data governance. That includes:
In plain English, everyone needs to measure the same thing the same way. Then the data needs built-in checks, side-by-side matching against source records, and a clear trail that shows where each number came from and how it moved through the system.