Published on
July 24, 2026

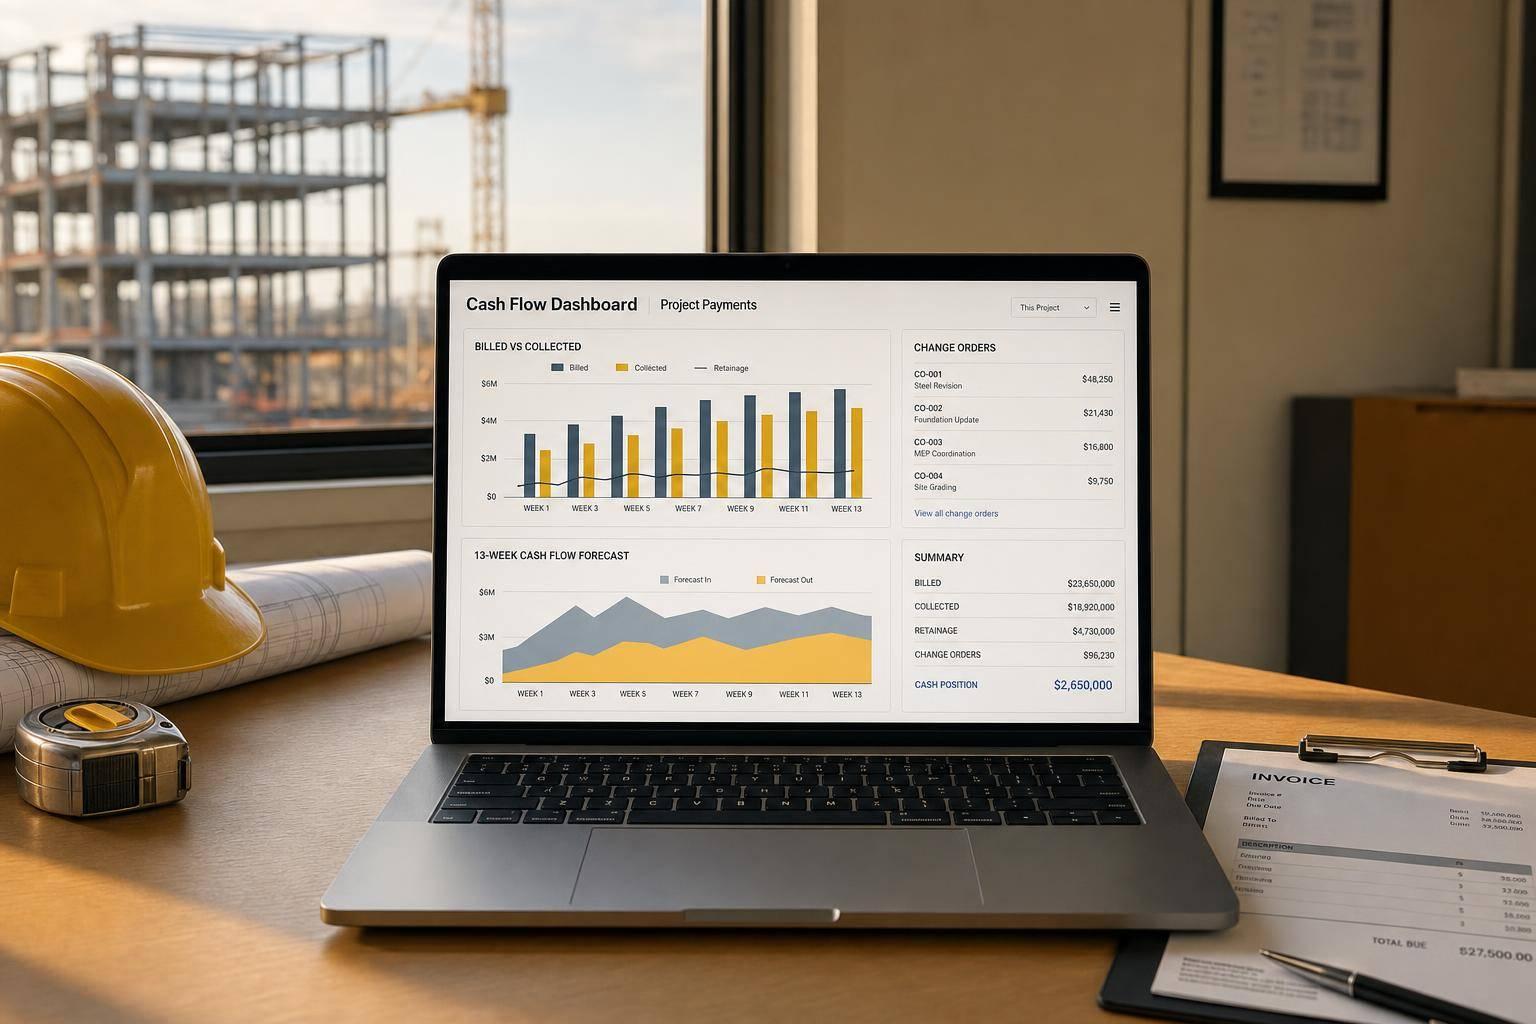
A construction job can show profit and still leave you short on cash. The reason is simple: work gets done first, invoices go out later, and payment may not hit your bank for 30 to 45 days or more. Add retainage, slow owner reviews, and pending change orders, and cash gets tight fast.
If I were setting up this dashboard, I’d keep it focused on the numbers that drive near-term cash:
The article’s main point is clear: an AR report is not enough. I need a weekly project-level view that shows when money is likely to arrive, then match that against payroll, AP, subcontractor draws, debt, and taxes. That is how I spot cash gaps before they hit.
A few examples make the risk plain. If I bill $500,000 on 07/31/2026 under net 45 terms, I may not get paid until 09/15/2026. If a job has $1,200,000 overdue, including a $500,000 invoice at 90+ days, that item should move to the top of my collection list. And if only 18% of contractors get paid within agreed terms, due dates alone are not enough for forecasting.
Here’s the short version of what this dashboard should do:

| View | What it tells me | What it misses |
|---|---|---|
| Static monthly AR reporting | Open invoices, aging, month-end balances | Whether cash will arrive in time for payroll and vendor payments |
| Weekly rolling cash forecast | Expected payment timing by week, near-term shortfalls, cash gaps | Requires clean data and steady updates |
In other words: the dashboard should not just report what I’m owed. It should show when I can use the cash. That’s the part that helps me plan ahead instead of reacting late.
On every job, track six inputs: contract value, billing status, payment timing, AR aging, retainage, and cash gap exposure. These numbers should feed a weekly cash forecast, not sit around for month-end reporting.
| Metric Category | Minimum Data Points | Purpose |
|---|---|---|
| Contract Value | Original contract, approved change orders, revised total | Sets the total billable amount |
| Billing Status | Billed amount, collected amount, open balance | Shows the gap between work performed and cash received |
| Timeline | Billing date, due date, actual payment date | Spots payment delays and feeds the cash forecast |
| AR Aging | Current, 1–30, 31–60, 61–90, 90+ days past due | Helps prioritize collections and flag high-risk accounts |
| Retainage | Retainage receivable, retainage payable, release triggers | Tracks cash held back until project completion and release milestones |
| Cash Gap Exposure | Overbilling, underbilling, pending change orders | Flags unbilled scope, disputed amounts, and delayed cash |
Taken together, these metrics show whether incoming project payments will cover payroll, subcontractors, and vendor bills on time.
Every project needs a billing record that includes the original contract value, any approved change orders, and the revised contract amount. That revised amount is your true billing ceiling. It drives percent-complete calculations and shows how much billable work is still left.
Each billing event should also record the invoice date, the due date based on contract terms, and the actual payment date once the money lands. From there, calculate the open balance by invoice and by project. Put billed, collected, and overdue balances next to each other so the picture is plain.
One of the biggest traps in construction finance is acting like billed revenue is cash in the bank. It isn't. A good dashboard makes that gap obvious at a glance.
Retainage needs its own area in the dashboard, not a tiny note at the bottom. Track retainage receivable - what owners owe you - and retainage payable - what you owe subs - separately for each project.
When retainage release gets delayed, cash stays stuck even after the work is done. That's why release triggers matter. The moment retainage becomes collectible, it should move into the forecast so the team can see when that cash may hit.
AR aging buckets - current, 1–30, 31–60, 61–90, and 90+ days past due - should be tied to the invoice due date, not the invoice date. That small detail matters. If an invoice is net-45, it isn't late until that due date passes. Age it from the invoice date, and you make collections risk look worse than it is.
Overbilling brings cash in earlier. Underbilling pushes cash out. Measure both by comparing billed-to-date against earned revenue based on cost-to-date versus estimated total cost.
If a contractor keeps underbilling on the same kinds of jobs, that's often a process issue. Maybe billing cutoffs are getting missed. Maybe change orders aren't being invoiced fast enough. Either way, the dashboard should make the pattern easy to spot.
Also, pending change orders should appear as a separate receivable until approved and billed. Until that happens, the money is not in hand. Unapproved change orders aren't just a scope issue. They're delayed cash.
Update these fields based on billing activity, collections, and change-order approvals so the next workflow can turn them into a real-time forecast.
Once you have the main cash metrics in place, the next step is to track billing and collections as they happen. The key is simple: build the dashboard around the owner's approved draw schedule, not just the invoice log in your accounting system.
Why does that matter? Because timing drives cash. If billing events are tied to the draw schedule, you can spot missed or late submissions right away instead of finding them at month-end, when the cash shortfall is already sitting there.
Put the scheduled billing date next to the actual invoice submission date. That side-by-side view makes delays hard to miss, and every delay can push cash receipt further out after the owner's review.
The dashboard should pull percent-complete data from the project management system and use it to calculate the expected billable amount for each billing period. If a scheduled draw date passes and there is no matching invoice record, the system should flag it as "not billed" and show the effect on the weekly cash forecast.
That alert should be visible to both the project manager and the billing team. In practice, this helps cut down on delays caused by missing paperwork or slow internal sign-off.
Each missed draw should flow straight into the weekly cash forecast.
Track change orders by status: pending, approved, rejected, and unbilled. Each one affects cash in a different way, so rolling them into one number hides the real story.
Here’s what that looks like. If a project starts with a $5,000,000 original contract and has $600,000 in approved change orders, the revised contract value becomes $5,600,000. If the same job also has $400,000 in pending change orders and $100,000 in rejected COs, the dashboard should make it clear that $400,000 of expected collections is still at risk.
Any pending change order above $100,000 or older than 30 days should be flagged for immediate follow-up. Those are often the items that throw off both margin and near-term cash inflows.[4][5]
Not every overdue invoice needs the same level of attention. The dashboard should sort outstanding balances by owner, project, dollar amount, and days past due. Then it should bring the most urgent collection items to the top based on owner payment habits, invoice size, and retainage.
An owner who pays 25 days past terms every time is one kind of risk. An owner who is late for the first time is another. Treating them the same can lead to bad calls.
The best collection view pulls together three signals at once:
Say a job has $1,200,000 overdue, including a $500,000 invoice that is 90+ days old, plus a history of documentation disputes. That job should be at the top of the list, with notes showing what has held up payment before. That turns a plain aging report into something people can act on.
Slow payments cost the U.S. construction industry an estimated $280 billion in 2024.[1][2][3] Use that priority list to update weekly cash forecasts and short-term borrowing needs.
That list should guide both near-term cash planning and collection calls.
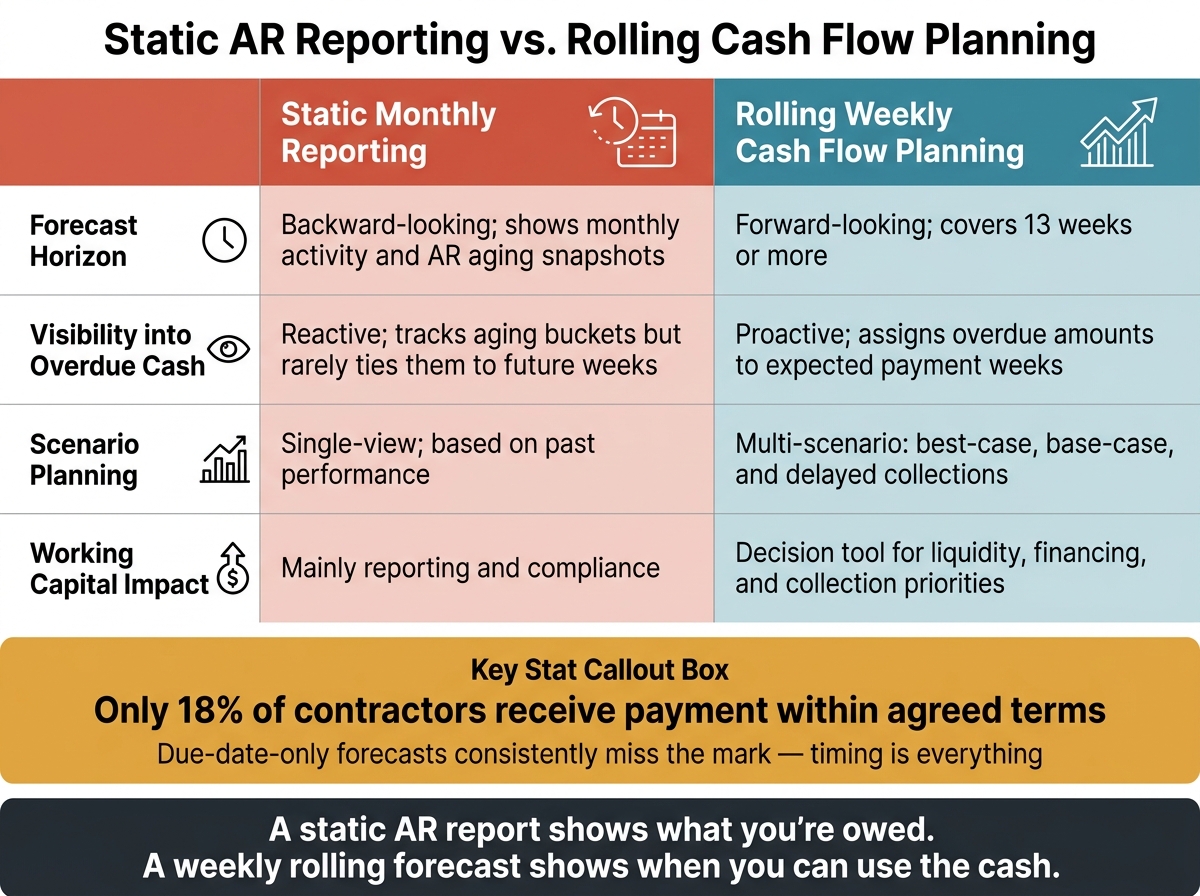
Static AR Reporting vs. Rolling Cash Flow Planning: Construction Dashboard Comparison
Overdue invoices only tell part of the story. What matters is when the cash is likely to land. Take the receivables list from the dashboard and slot each balance into the week you expect payment. That timing turns project billing schedules into a cash plan the whole company can use.
A construction cash flow dashboard should lay out inflows in a weekly view and a 13-week rolling forecast, with weeks across the top and projects down the side. Each row should show the project, owner, invoice number, billed amount, retainage, net collectible amount, due date, expected payment week, and risk status. It should also include scenario views for best-case, base-case, and delayed collections.
In day-to-day use, the forecast should pull data from the AR subledger, project billing schedules, owner contracts, and past payment behavior. Use the billed date, due date, retainage, and dispute status to place each receivable into a future week. It should also split receivables into three groups:
A 13-week horizon is a good fit for short-term liquidity planning because it gives contractors enough room to plan for payroll, subcontractor draws, and line-of-credit use. Due dates are only part of the picture. Owners often pay late in construction, so contract dates by themselves can paint too rosy a picture. Only about 18% of contractors receive payment within agreed terms [6], which is why forecasts based only on due dates usually miss the mark.
Once inflows are mapped out, the next step is to match them against the week each payment will actually leave the bank account. That means actual payroll dates, subcontractor payments by due date, supplier and vendor invoices based on due date and terms, plus equipment, debt, and tax payments.
Each week should show total projected inflows, total projected outflows, net cash flow, and ending cash balance. Any week where the projected balance drops below a minimum operating cash floor should stand out right away. For many contractors, that floor might be enough cash to cover at least one payroll cycle.
When a shortfall shows up early, the dashboard should help the team act before it turns into a jobsite problem. That may mean pushing collections, delaying non-critical vendor payments, or drawing on a line of credit before the gap gets too tight.
Static reporting shows exposure. Rolling forecasts show timing.
| Feature | Static Monthly Reporting | Rolling Weekly Cash Flow Planning |
|---|---|---|
| Forecast horizon | Backward-looking; shows monthly activity and AR aging snapshots | Forward-looking; covers 13 weeks or more |
| Visibility into overdue cash | Reactive; tracks aging buckets but rarely ties them to future weeks | Proactive; assigns overdue amounts to expected payment weeks |
| Scenario planning | Single-view; based on past performance | Multi-scenario; supports best-case, base-case, and delayed collections |
| Working capital impact | Mainly reporting and compliance | Decision tool for liquidity, financing, and collection priorities |
A static AR report shows what the company is owed and how old those balances are. What it does not show is whether cash will be there in time for payroll. A weekly forecast does. It gives a clear view of funding gaps before they hit payroll, vendors, or both.
A weekly forecast is only as good as the data behind it. If the source data is messy, the dashboard will be messy too.
At a minimum, pull data from four systems: your GL, job costing system, billing system, and retainage/change-order tracker. That way, billed amounts, retainage, and collections all reconcile inside one project view.
You also need one reporting layer across those sources. Project IDs, customer names, and cost codes should match everywhere. If one system says "Project 214-A" and another says "214A", small errors can snowball fast. The goal is simple: a single transaction updates both job costing and the GL, so you avoid duplicate entry and cut down on month-end reconciliation work.
Refresh the dashboard every week and reconcile it every month. Tie that process to bank reconciliations, WIP validation, and over/underbilling checks. Weekly updates keep the view current. Monthly reconciliation makes sure the numbers still hold up.
Once the systems are connected, assign ownership for each field. Finance should own field definitions like invoice date, due date, retainage release date, and change order status. Finance should also approve any structural changes. Project managers can update status fields, but they should not change historical financial data.
A few alert rules can save a lot of pain. Set up alerts for:
Those alerts help catch problems before they stack up.[8][7]

For contractors that want this built into a repeatable finance process, Phoenix Strategy Group helps growth-stage contractors bring accounting, job costing, billing, and cash flow data into one dashboard.
Their fractional CFO leadership ties dashboard metrics to day-to-day decisions, like when to add crews, go after larger contracts, or line up short-term financing. They also help with lender conversations by showing disciplined cash management and more predictable collections.
Used this way, the dashboard becomes a weekly decision tool, not just a reporting screen.
Review these five numbers every week:
When founders and project leaders review these numbers in steady weekly time buckets, they get enough lead time to escalate collections, renegotiate terms, or adjust spending before a cash shortfall hits payroll. A good dashboard doesn't just report what happened. It shows what's coming and gives the team room to act.
An AR report isn’t enough because it gives you a static, backward-looking snapshot. It shows what happened, not what’s happening right now. And when that report is built by hand, delays creep in fast. By the time a decision-maker reads it, the numbers may already be days or even weeks old.
It also misses the bigger cash flow picture. Yes, it shows what customers owe. But it doesn’t show when that money is likely to come in. And that gap matters. An AR report won’t tell you about vendor payments coming due, delayed project milestones, or how slow receivables can squeeze payroll, vendor bills, and day-to-day project costs.
Show retainage separately from standard progress billings to get a clearer view of liquidity and working capital.
Put it in its own category within accounts receivable aging or project summaries. That way, your team tracks it as a long-term receivable instead of treating it like a current invoice that should turn into cash soon.
That simple split helps surface future cash inflows more clearly when you build cash flow forecasts.
A 13-week cash forecast is a rolling tool that helps you spot potential liquidity gaps before they turn into a problem. It should pull from both past data and current trends, including AR turnover rates by customer segment, so you can better predict when cash will actually come in.
Your forecast should account for expected cash inflows, such as progress payments and receivables, along with cash outflows like payroll, vendor and subcontractor payments, rent, overhead, debt repayments, taxes, and planned capital investments.