Published on
July 26, 2026


If I were getting a CPG brand ready for Series B, I’d focus on six things first: clean GAAP financials, a working 3-statement model, SKU and channel margins, cohort data, retailer velocity, and board/legal records. That’s the short version.
By this stage, investors usually aren’t asking, “Is this product interesting?” They’re asking, “Can this company grow 40%–60%+ year over year without losing control of margin, cash, and execution?” If I can’t answer that with clear files and matched numbers, the process slows down fast.
Here’s what I’d want done before outreach:
A simple way to think about it: your story, your model, and your records all need to say the same thing. If one breaks, diligence gets harder.
This article lays out what I’d prep, what numbers matter most, and what investors are likely to test first.
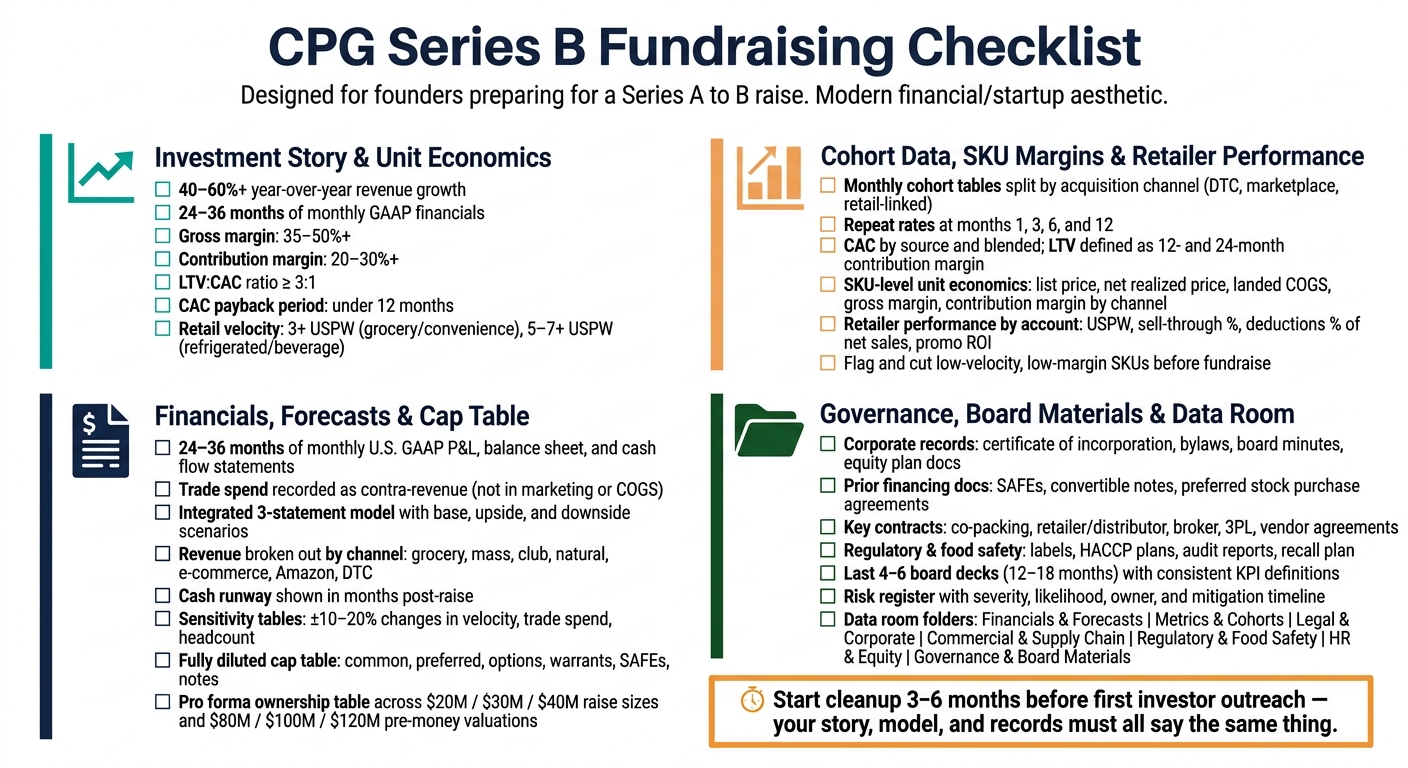
CPG Series B Fundraising Checklist: Key Metrics & Documents
Series B diligence usually starts with a blunt question: does this business earn the right to raise this round now? This section is where you prove the company can scale with enough profit to make it through a close review. These three checks set the standard for the financial model and KPI package that come next.
Series B investors want steady 40–60%+ year-over-year growth, backed by 24–36 months of monthly revenue and gross profit data in U.S. dollars.[6][3][2] One hot launch quarter followed by stalled growth is a red flag.
Door count, by itself, doesn't say much. Investors care more about unit sales per store per week (USPW) because it shows whether the product is actually moving. In grocery and convenience, 3+ USPW is often treated as viable. In refrigerated or on-premise beverage categories, 5–7+ USPW is a common benchmark.[7] If velocity stayed flat or improved after launch promos tapered off, spell that out. That kind of staying power matters.
Shelf-space gains and category resets matter as well. If a major grocery banner gave you more shelf space or reset the category based on your results, put that in the story - and back it up with data. The revenue pattern here should line up with the financial model investors will pressure-test later.
Your raise amount needs to be exact - for example, $25 million in Series B equity. Just as important, your use of capital needs to be split into clear buckets tied to measurable outcomes. A vague line like growth and marketing won't survive diligence. Break the raise into buckets linked to milestones investors can track.[2][3][6]
Tie that raise to specific channel goals, such as:
The plan should feel like a direct extension of past results, not a shopping list of hopes.[2][3][6]
The story falls apart if the math doesn't work. Series B investors in CPG often screen for gross margins of 35–50%+, depending on category, contribution margins of 20–30%+ after trade and variable costs, and LTV:CAC ratios of at least 3:1 with payback periods under 12 months.[4][5][6]
Show these metrics by channel in standard U.S. format:
| Metric | Target Example | Investor Threshold |
|---|---|---|
| Gross Margin | 42.0% | 35–50%+ |
| Trade Spend (% of Gross Sales) | 15.0% | 10–20% |
| Contribution Margin | 23.0% | 20–30%+ |
| DTC CAC | $45.00 | Category-dependent |
| 12-Month LTV | $180.00 | LTV:CAC ≥ 3:1 |
| CAC Payback Period | 7 months | Under 12 months |
Don't stop at a single snapshot. Show trend lines and downside cases so investors can see that you understand the economics beneath the top-line growth. These metrics should become the baseline for the SKU and channel analysis in the next section.
Once your investment story holds up, investors go straight to the numbers. At that point, the question isn’t “Is this interesting?” It’s “Do the books support the story?” So before you open a data room, you need your financials, forecast model, and cap table in clean shape.
Investors move from the pitch to the books fast. You should have 24–36 months of monthly U.S. GAAP financial statements ready: P&L, balance sheet, and cash flow. And they can’t just exist side by side. They need to tie together cleanly. Net income should roll into retained earnings, and ending cash on the cash flow statement should match the balance sheet.[14]
For CPG brands, trade spend is the most common CPG accounting issue. That’s where things often get messy.
Slotting fees, scan allowances, billbacks, chargebacks, and retailer deductions need to be recorded as contra-revenue, not tucked away in marketing or COGS. Retailers often invoice 60–90 days after a promotional period ends, which creates a problem if a brand books trade spend only when the invoice arrives. One quarter can look strong, then the next gets hit when several months of deductions land at once. The fix is simple in concept, but it takes discipline: use a monthly trade spend accrual by retailer and promotion, and keep a deduction reserve on the balance sheet to absorb valid short-pays before they hit the P&L.[8][9][12]
You’ll also want to break out COGS into the main cost buckets:
Then tie those costs to inventory rollforwards, inventory aging by 0–90, 91–180, and 180+ days, and obsolescence reserves. Investors will also ask for AR and AP aging schedules, along with working capital KPIs like DSO, DPO, and inventory turnover.[14]
Your forecast should sit inside an integrated three-statement model. That means the P&L, balance sheet, and cash flow all connect, so when revenue shifts or margins change, the effect on cash runway shows up right away. That’s what investors want to test.
Revenue should be broken out by channel: grocery, mass, club, natural, e-commerce, Amazon, and DTC. Each channel should have its own assumptions for distribution gains, velocity, pricing, and promotional intensity by account. Margin assumptions should sit at the SKU or product-family level, and inventory planning should connect production schedules to forecast sales and safety stock. That flow should then show up in inventory balances on the balance sheet and in cash outflows.[14]
Build three scenarios:
Each scenario should show cash runway in months post-raise. Add sensitivity tables so investors can see how runway moves under ±10–20% changes in velocity, trade spend as a percentage of sales, or headcount timing. You should also include a sources-and-uses schedule tied to the model.[14]
The key point here is timing: build this model before outreach starts, not after. If an investor wants to test cash needs on the spot, you need answers right away.
After the model, investors usually test ownership and control. They want to know who owns what now, what converts later, and how the new round changes the picture.
List every equity and equity-like instrument on a fully diluted basis: common, preferred, options, warrants, SAFEs, and notes. For each line, show the holder, security type, shares or units, price per share, ownership, and vesting status. Also include the current option pool, granted shares, remaining shares, and any planned increase at Series B.[11]
Preferred shares should be grouped by series, with clear notes on liquidation preferences such as 1x non-participating, participating, or participating with a cap, plus conversion terms and any anti-dilution provisions. For SAFEs and convertible notes, show the principal amount, discount or valuation cap, interest rate if it applies, and the assumed conversion price and share count at your expected Series B valuation.[11][13]
You should also prepare a pro forma ownership table that layers in the proposed raise amount, pre-money valuation, new shares issued, and any option pool expansion. Show pre- versus post-round ownership for founders, employees, prior investors, and new Series B investors in both percentage and absolute share terms. A scenario matrix across raise sizes like $20 million, $30 million, and $40 million, and valuation levels like $80 million, $100 million, and $120 million pre-money, makes negotiation a lot easier because dilution stays visible the whole time. If it matters, note control issues too, including board changes, consent rights, and protective provisions. And before the data room opens, make sure the cap table ties back to your corporate records, including stock ledgers and board approvals.[10][11][13]
Once the model and cap table are clean, investors shift to a different question: is demand holding up, and where does the business actually make money? That shows up in three places - customer behavior, SKU margins, and retailer-level results.
With the financials and ownership cleaned up, diligence starts to test operating quality. Investors want to see repeat demand, margin by product, and whether retail partners are helping or hurting the business.
Use a monthly cohort table, not a blended retention rate. Build it from transaction-level data and split it by acquisition channel: DTC, marketplace channels like Amazon and Walmart.com, and retail-linked sources such as QR codes or in-store sampling. For each cohort, show month 1, 3, 6, and 12 repeat rates, first-order revenue, cumulative revenue per customer, and contribution margin per customer at 30, 90, 180, and 365 days.[19][21]
This channel split matters. Different sources bring in different kinds of customers with different unit economics. A DTC cohort may show a 40% repeat rate by month 3, while a retail-linked cohort may be closer to 25%.[21] Blend those together, and the signal gets muddy.
Also show CAC by source and on a blended basis across channels. Define LTV as 12- and 24-month contribution margin per customer, not revenue.[19][21] Investors will usually want a 12- to 18-month trendline that shows whether blended CAC and payback are getting better or drifting up.[18]
Before diligence starts, line up the definitions across every channel. Customer should mean a unique individual or account ID. Order should exclude returns and cancellations. Revenue should be net of discounts and refunds. When Shopify, Amazon, Walmart.com, and retail POS feeds all use the same rules, the cohort analysis is much easier to trust.
Use the cohort data to figure out which SKUs are driving repeat revenue and margin, not just top-line sales.
For each active SKU, build a unit economics worksheet with list price, net realized price after trade terms, landed cost split into raw materials, packaging, co-manufacturing, freight, and warehousing, plus gross margin in dollars and as a percentage.[16]
Trade spend should sit at the SKU and channel level. Gross margin can drop fast once trade and other variable costs are included.[17] Add direct variable costs such as pick/pack, marketplace commissions, and freight to consumer so you can see true contribution margin by SKU and by channel.
Then rank every SKU by:
Flag any SKU with weak velocity, high complexity, or negative contribution after trade spend. Cut low-velocity, low-margin SKUs before the fundraise. In diligence, weak products tend to become a time sink, and they rarely get easier to defend.[17]
After that, test those same SKUs at the account level. This is where you see whether velocity, deductions, and promo spending create value or eat it away.
Retailer performance should be organized by account and region, not just rolled up into one company-wide view. For each account, track units per store per week, sell-through percentage, reorder frequency, deductions as a percentage of net sales, returns, and promotion ROI. Velocity and sell-through together show consumer pull. Strong velocity with weak sell-through can point to overstocks or poor shelf placement.[20][22]
Measure promo ROI using incremental lift over baseline, net of post-promo decay. Include every promo cost: off-invoice, billbacks, scan-backs, display fees, and ad support.[15][20]
A simple account-level comparison table can look like this:[20][22]
| Retailer | Stores | Velocity (units/store/week) | Monthly Net Sales | Contribution Margin % | Deductions (% of net sales) |
|---|---|---|---|---|---|
| National Grocer A | 500 | 14.8 | $215,750 | 38.5% | 3.2% |
| Regional Chain B | 150 | 9.3 | $58,400 | 32.0% | 6.7% |
| Mass Retailer C | 320 | 11.5 | $134,200 | 35.1% | 4.8% |
Pair that with a SKU margin by channel template so investors can see where each product earns money:
| SKU Margin by Channel | Direct-to-Consumer (USD) | Wholesale/Retail (USD) | Marketplace (USD) |
|---|---|---|---|
| Gross Revenue | $0.00 | $0.00 | $0.00 |
| Trade Spend / Deductions | ($0.00) | ($0.00) | ($0.00) |
| Net Revenue | $0.00 | $0.00 | $0.00 |
| Landed COGS | ($0.00) | ($0.00) | ($0.00) |
| Contribution Margin | $0.00 | $0.00 | $0.00 |
| Margin % | 0.0% | 0.0% | 0.0% |
Add short notes to both tables that call out which accounts look ready for deeper expansion and which ones need new terms, cleaner execution, or both.
Once investors trust the numbers, they move to something less flashy but just as important: how clean the company is on paper. If governance records are incomplete, board consents are missing, or contracts are scattered across inboxes and shared drives, Series B diligence can drag fast. This section covers what to pull together before investors get access.
Investors usually start with a few basic checks: Who controls the company? What agreements shape the business? Where could legal or compliance issues show up?
Start with the corporate and governance folder. It should include the certificate of incorporation and any amendments, bylaws, board and stockholder minutes, equity plan documents, issuance and grant records, written consents for major decisions like option grants and debt approvals, and all prior financing documents, including SAFEs, convertible notes, preferred stock purchase agreements, and investor rights agreements kept in the corporate records.[23][24][25] One common diligence problem is simple but painful: missing or unsigned board consents for past decisions.
Then move to your key commercial and supply chain contracts. That includes co-packing and manufacturing agreements, major retailer and distributor agreements, broker and sales agency contracts, 3PL agreements, and key vendor contracts for packaging and ingredients. For each contract, add a short summary sheet with:
Also flag any dollar exposure tied to minimums, penalties, or similar terms so investors can size concentration risk without digging through every agreement.[1]
For U.S. CPG companies, regulatory and food safety documentation should live in its own folder. Include labels, registration records where needed, HACCP plans, audit reports, supplier quality agreements, and a written recall plan. That plan should spell out who handles consignee notifications, public alerts when needed, effectiveness checks, and disposal of recalled product.[28][27][29][30]
Include the last four to six board decks covering the past 12 to 18 months. These decks are the running record that shows whether the metrics from Sections 1–3 are not just tracked, but used. Each one should cover net revenue, gross margin, contribution margin by channel and top SKUs, cash burn, runway, cohort and retention metrics, retailer and channel performance, headcount updates, and strategic priorities.[1][26]
Before you share them, clean them up. Remove draft notes, mark final versions clearly, and make sure KPI definitions match from deck to deck. Nothing slows review like investors trying to figure out whether the same metric means two different things in two different quarters.
Risk reporting matters just as much as performance reporting. A simple risk register inside each board deck can go a long way. Columns for severity, likelihood, owner, and mitigation timeline show that leadership is paying attention. If the top three U.S. retailers account for 68% of net revenue, say that plainly and pair it with a diversification plan.[1][26][32]
Put all of this in a clean, steady data room so investors can review it without chasing versions or asking where the latest file lives.
Use one folder structure across every diligence request. Keep the top-level folders consistent:
Inside each folder, use plain subfolders that tell people exactly where to look. For example, Legal & Corporate → Charter Documents and Legal & Corporate → Prior Financing.
File names should also be consistent, with U.S. date formatting throughout. A file like Board_Deck_Q2_2026_Final_07-27-2026.pdf leaves little room for confusion. Keep one "FINAL" subfolder for the files investors should rely on. Move drafts and older versions into a restricted archive folder, and limit access to folders that hold more sensitive material.[31][32]
At the top level, add a readme or index document. It should list each folder, explain what it holds, and name the right point of contact for follow-up questions. Many teams build this structure before the raise starts and update it each quarter so it stays ready between rounds.
| Data Room Folder | Key Documents to Include |
|---|---|
| Financials & Forecasts | Historical statements, 3-statement model, cash runway, scenario analyses |
| Metrics & Cohorts | Cohort tables, CAC/LTV by channel, SKU margin analysis, retailer velocity |
| Legal & Corporate | Charter docs, bylaws, board consents, cap table, prior financing agreements |
| Commercial & Supply Chain | Co-packing agreements, retailer contracts, 3PL agreements, vendor contracts |
| Regulatory & Food Safety | Labels, FDA/USDA registration, HACCP plans, audit reports, supplier quality agreements, recall procedures |
| HR & Equity | Option plan, grant records, key employment agreements |
| Governance & Board Materials | Board decks (last 12–18 months), KPI summaries, risk register |
Use this checklist to make sure your story, numbers, and records line up before outreach. Start this cleanup three to six months ahead of time so everything is ready before the first investor call.
Each item builds on the one before it, so it helps to move through them in sequence:
When all of this is done, investors can check the story fast and spend their time on the round itself.
Start preparing 6 to 12 months before you need the capital. That window gives you room to build investor relationships, sharpen your pitch, and fine-tune your strategy without the stress of a shrinking cash runway.
During that time, get your financial records, legal documents, and operating data in order. Put everything into a virtual data room so you're ready when investors start digging in.
Series B investors in CPG want clear proof that growth can scale without getting messy or too expensive.
The metrics they care about most are:
They also dig into operational efficiency. That usually means looking at inventory turnover, net burn rate, stable retail partnerships, and strong revenue per SKU.
Prioritize transparency and clear proof that the business can grow without falling apart. Include a fully diluted cap table, 12 to 24 months of historical financial statements, 12 to 18 months of projections, and core corporate records such as bylaws, board minutes, and an organizational chart.
You should also include cohort analysis, unit economics like LTV:CAC, and all material contracts and intellectual property. Put everything in a secure, indexed virtual data room, and make sure your metrics stay consistent across every document.