Published on
September 12, 2026


Fast growth can hurt cash long before it shows up in revenue reports. If sales climb but receivables climb faster, you can end up with a DSO above 42 days, more invoices drifting past 60+ days, and too much AR tied to a few big customers.
If I had to sum up the article in plain English, it would be this:
The core metrics are simple: DSO, aging buckets, bad debt rate, customer concentration, expected loss, and exposure by segment. The article also gives clear action points, like putting caps on single-customer exposure, reviewing accounts that pass 60 days past due, and stress-testing cases where DSO extends by 15 to 20 days or top customers fail.
A few points stand out:
In short, I’d treat credit risk as a cash control system: set limits, score customers, track warning signs, and feed all of it into forecasting and reporting.
That’s the article’s main message in one view.
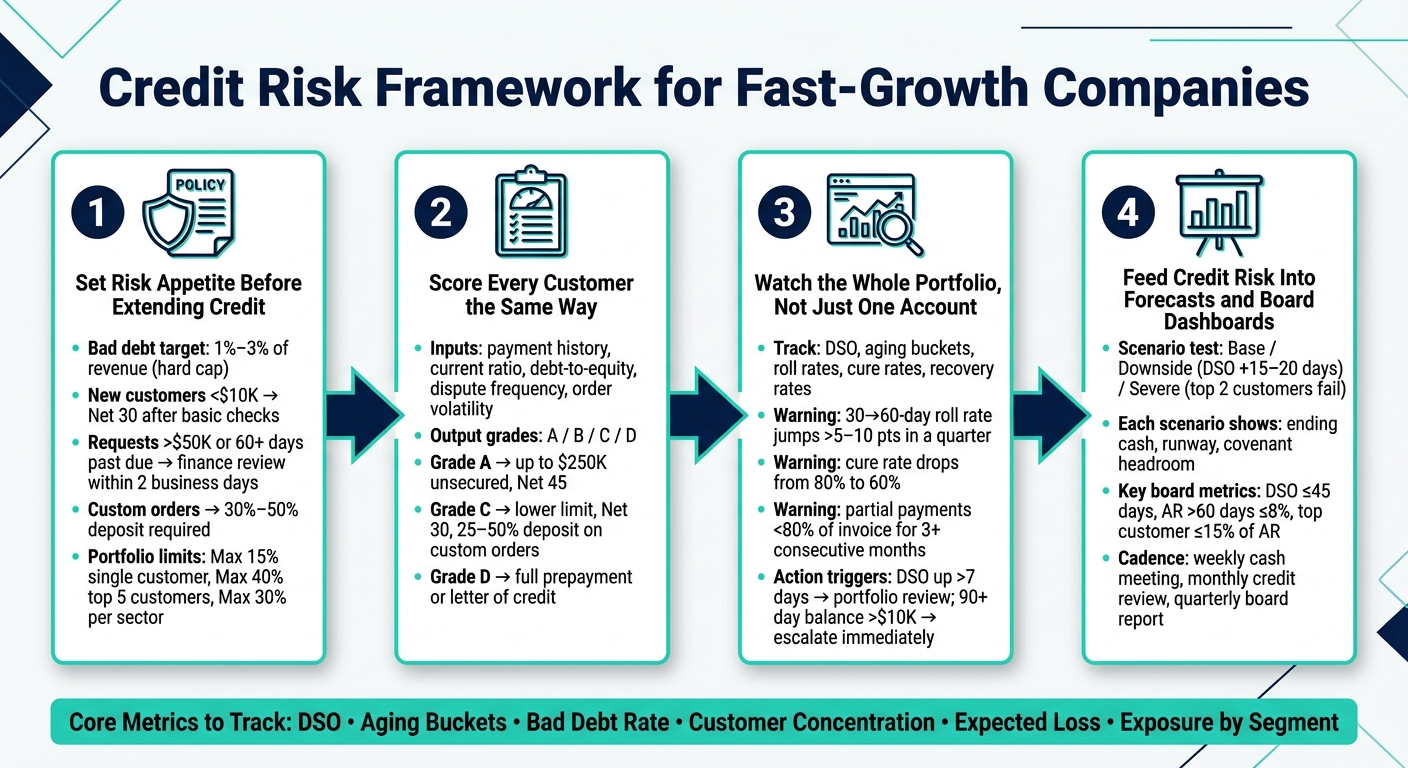
Credit Risk Framework for Fast-Growth Companies
Use the metrics above to turn risk from a dashboard into policy.
Fast growth pushes teams to make credit calls fast. If you don't set written limits, sales can outrun collections and customer concentration can creep up before anyone spots it. Set your risk appetite before you extend more credit. Decide how much you can afford to lose, how slow collections can get, and how much exposure you're willing to carry with one customer or one sector.
Treat bad debt rate as your loss ceiling, not just something you look at after the fact. B2B write-offs usually run 1%–3% of revenue.[1] Set a target band and a hard cap that ties back to your forecast and any loan covenants.
Use payment terms to manage DSO, not as a default sales move. Net 30 works for many smaller U.S. customers. Larger enterprise accounts may ask for Net 45–60, but slower cash flow should come with tighter credit limits. If you offer 1%–2% early-pay discounts, compare that cost with your borrowing rate before you make those discounts standard.
A simple baseline looks like this:
These limits protect the whole receivables book, not just one account at a time.
| Limit Category | Measurement Basis | Example Threshold |
|---|---|---|
| Single Customer | % of total accounts receivable | Max 15% of total AR |
| Top 5 Customers | % of total accounts receivable combined | Max 40% combined |
| Sector (Industry) | % of total accounts receivable per NAICS sector | Max 30% in any single sector |
| Product Line | % of total accounts receivable per product/service category | Max 35% in any single product line |
| High-Risk Rating Tier | % of total accounts receivable in lowest internal rating | Max 10% in high-risk tier |
Don't leave these limits sitting in a policy doc that no one checks. Build them into the order workflow. That way, the system flags problems before exposure gets too high. If a strategic exception makes sense, senior finance should sign off and require a plan to reduce risk, such as tighter terms, collateral, or trade credit insurance.
These rules become the inputs for your credit scoring model.
Once you've set credit limits, the next step is to turn them into a process your team can use again and again. That's where an internal scorecard comes in.
A scoring system doesn't replace human judgment. It gives it structure, so your team applies the same logic to every customer instead of making each call from scratch.
Start with the data your team already watches. In most cases, payment history matters most: days past due, number of late payments, missed promise-to-pay dates, and any past collections activity. Then add a few basic financial ratios when you can get them, such as current ratio, debt-to-equity, and operating cash flow coverage.
It also helps to track operating signs that can show trouble before an invoice goes unpaid. That can include:
For small or newly onboarded customers, audited financials often aren't available. So keep it simple. Use bank reference letters, recent bank balance details, and any internal payment history you already have. If key inputs are missing, cap the rating and move to shorter terms or partial prepayment.[3][6][8]
Those inputs should then roll up into one plain rating scale your team can use without guesswork.
Start with a rule-based scorecard. Assign points across your main inputs - payment history, liquidity, leverage, disputes, and order volatility - and then map the total to grades like A, B, C, and D.
| Dimension | Manual Judgment Only | Internal Scoring Framework |
|---|---|---|
| Consistency | Varies by decision-maker | Standardized across all accounts |
| Speed | Slow; frequent escalations | Fast for most accounts |
| Scalability | Bottleneck as volume grows | Handles higher volume with modest added staff |
| Data needs | Informal, undocumented | Structured inputs with clear refresh cadence |
Just as important, write down how the system is managed. Spell out who owns each rating, how often scores are refreshed, when a manual review is needed, and how overrides are approved and checked.[4][7][9]
Without that kind of control, even a good scorecard can drift over time.
A score should change what happens next. If it doesn't, it's just a label.
Tie each grade to a clear action. For example, Grade A customers may qualify for up to $250,000 in unsecured credit on Net 45 terms. Grade C customers might get a lower limit, Net 30 terms, and a 25%–50% deposit on custom orders. Grade D customers may need full prepayment or a letter of credit.[3][5]
Build those rules into your CRM or ERP so sales reps can see the outcome right away. And unless there's a documented override, the system should stick to the rule.[3][5]
The same grades should also feed exposure reporting and collections tracking. That way, portfolio risk shows up early instead of after balances start piling up.
Once scoring is in place, the next step is to watch the whole portfolio, not just one account at a time. A single-account review can miss slow-building risk that only shows up when you zoom out. One customer, for example, can quietly grow into a large chunk of your receivables without setting off alarm bells at the account level.
Track total exposure, not just open invoices. That means pulling in invoices, unused commitments, installment balances, guarantees, and related-entity exposure. Open invoices tell part of the story. Total exposure tells the whole credit picture.
Give each customer a group ID in your ERP or data warehouse, then join every exposure component to that ID each day. Pull the data from invoicing, billing, CRM, and collections into one exposure table. The end result should be one number for each customer group: total exposure in USD, with the amount split by exposure type. From there, calculate each group's share of total receivables and flag any customer or group that goes past its set limit.[2][12]
Exposure only matters if you track how it changes. Don't just look at where balances sit today. Watch how they move between aging buckets.
Roll rates show the share of balances that move from one bucket to the next, and cure rates show the share of delinquent balances that return to current status.[10][11][13][14][15] If your 30→60-day roll rate jumps by more than 5–10 percentage points over a quarter, or if your cure rate in the 31–60-day bucket falls from 80% to 60%, that's a plain warning sign. Customers aren't just late. They're slipping further behind.
Recovery rates matter as well. They show how much you collect from charged-off or defaulted balances, and they help shape loss forecasting and pricing.[11][15]
Some warning signs show up even before the aging report gets worse. Broken payment plans, partial payments that leave a steady shortfall, and more disputes can all point to strain. If a customer keeps paying $50,000 on an $80,000 monthly invoice, month after month, that's a cash-flow signal long before any invoice reaches 60 days past due.[16][17][18]
Monitoring only works when each signal leads to a clear decision. The table below ties the main early-warning indicators to the action required, the person who owns it, and the response window. These thresholds should sit inside your credit policy and, where possible, trigger automated alerts in your ERP or BI dashboard.
| Early-Warning Indicator | Threshold / Trigger | Required Risk Action | Owner | Response Time |
|---|---|---|---|---|
| Company-wide DSO increase | DSO up >7 days vs. 3-month average | Portfolio review; pause all limit increases | CFO / Fractional CFO | Within 5 business days |
| Customer 61–90-day past-due exposure | >10% of customer's total outstanding | Credit review; stop new credit shipments until payment plan is agreed | Credit Manager | Within 3 business days |
| Customer 90+ day past-due invoices | Any balance >$10,000 at 90+ days | Escalate to collections; evaluate legal action or write-down | Collections Lead | Immediate; decision within 10 business days |
| Broken payment plans | ≥2 broken plans within 6 months | Reduce credit limit 25–50%; shorten terms; require senior approval for new exposure | Credit Manager | Within 5 business days |
| Dispute frequency | >5 disputes per 100 invoices in a month | Billing process review; temporary hold on limit increases | AR / Billing Lead | Within 10 business days |
| Partial-payment pattern | ≥3 consecutive months with <80% of invoice paid | Initiate structured payment plan; reassess credit grade | Collections Team | Within 5 business days |
These triggers should also feed forecast updates and board reporting.
When credit risk lives in a separate spreadsheet, finance teams miss part of the picture. That gap gets bigger as a company grows. Signals from portfolio monitoring only help if they change how you forecast cash, make spending calls, and talk to investors.
Your cash forecast should account for DSO, delinquency, and recovery timing. A simple way to do that is to split revenue into cash sales and credit sales, then apply collection curves by segment. From there, add expected-loss reserves by risk tier so both the P&L and balance sheet reflect likely write-offs. Recovery timing matters too. It helps estimate how long past-due receivables take to turn into cash, whether that means an extra 1 to 3 months for cured accounts or much longer when legal action is involved.
Expected loss rates should also feed straight into the forecasted credit loss reserve. For example, a low-risk customer segment might carry a 0.5% loss rate, while a high-risk segment runs 3–5%. That reserve appears as bad debt expense on the income statement and as an allowance for doubtful accounts on the balance sheet. That keeps the forecast aligned with U.S. GAAP and ready for board review. [23][26]
Then pressure-test the model with at least three scenarios:
Each scenario should show ending cash, runway, and covenant headroom. [23][24][25]
Those same assumptions should flow into the board view so leaders can see whether liquidity risk is rising or staying contained.
Keep the dashboard to one page. A table, DSO trend, aging chart, and concentration chart are usually enough. [20][28]
Use the template below to keep reporting short and action-focused.
| Metric | Threshold / Target | Current Period | Prior Period | Status | Management Action |
|---|---|---|---|---|---|
| Days Sales Outstanding (DSO) | ≤ 45 days | 52 days | 44 days | Above limit | Tighten credit terms; expand collections team |
| % AR > 60 days past due | ≤ 8% of total AR | 12% | 7% | Above limit | Implement dunning; escalate top 20 accounts |
| Top customer as % of total AR | ≤ 15% | 19% | 16% | Above limit | Reduce limits; diversify new sales pipeline |
| Top 5 customers as % of revenue | ≤ 40% | 47% | 42% | Above limit | Target lower-risk segments for growth |
| Quarterly write-offs as % of revenue | ≤ 1.0% | 1.8% | 0.9% | Above limit | Review underwriting; revise scoring cutoffs |
| Recovery (cure) rate | ≥ 70% of delinquent AR | 62% | 68% | Below target | Enhance payment plans; initiate legal review |
| Base case runway (months) | ≥ 12 months | 11 months | 13 months | Below target | Advance fundraising by 3–6 months |
| Downside case runway (months) | ≥ 9 months | 7 months | 10 months | Below target | Freeze net new hiring; revisit covenants |
The Status column should stay simple: Above limit, Below target, or On track. In slides, color-coding can help. The Management Action column is what turns the dashboard into a tool for decisions instead of a passive update. [22][29]
After the dashboard is set, give each metric a single owner so the numbers stay current.
Credit approvals and standard limits should sit with the credit or risk function under a board-approved policy. The CFO should approve exceptions in writing and log them. The AR team should handle collections escalation, FP&A should update the forecast, and the CFO should own the board package. [19][21][20]
Cadence matters too. Run a weekly cash meeting to review upcoming receipts, high-risk accounts, and the 13-week cash forecast. Hold a monthly credit risk review to refresh concentration, aging, and stress-test assumptions. Deliver quarterly board reporting with the trimmed dashboard and trend commentary. In periods of fast growth or macro stress, move DSO and delinquency monitoring to weekly. [27][23]
Fast growth brings real credit risk with it. Revenue goes up, the customer base gets bigger, and the push to close deals can nudge credit decisions past what the business can handle. This framework helps stop that.
Put together, these steps move credit risk from ad hoc calls to a managed system. The order matters: set policy, score customers the same way each time, cap concentration, and use collections data to spot deterioration early. When expected losses and collection timing feed into the forecast, leadership sees more than top-line growth. They see the cash reality behind it.
Strong credit discipline doesn't slow growth. It helps growth last. Clear ownership, plus weekly, monthly, and quarterly reporting, keeps the process on track. The goal is simple: turn fast growth into durable cash flow.
A good Days Sales Outstanding (DSO) target depends on your business model.
For most B2B SaaS companies, a solid target is under 35–40 days. Service-based businesses should usually aim for under 30 days.
Treat DSO as a leading sign of collection health. It gives you an early read on whether cash is coming in on time or starting to slip.
If DSO climbs above 45 days, that’s often a sign you need to act fast:
Refresh internal credit scores based on each partner’s risk level.
For high-risk entities, update scores monthly. For lower-risk partners, a quarterly or semiannual cadence usually makes more sense.
It also helps to watch for major triggers. For example, a 10-point drop within 30 days should lead to an immediate review, even if the next planned update is still weeks or months away.
In fast-growth environments, current data matters. Old numbers can go stale fast.
Update credit risk assumptions when real-world shifts start hitting collections or liquidity, not just once a year on a set schedule.
Recalibrate when DSO climbs, key customers move receivables into older aging buckets, or collections miss the mark, such as a weekly receipts shortfall of more than 20.0%. That way, the 13-week forecast stays useful when cash flow starts moving around.