Published on
September 12, 2026


If you want to test one input, use sensitivity analysis. If you want to test a whole future, use scenario analysis.
That’s the short answer.
When I look at valuation risk, I split the job into two parts:
This matters because small changes can move value by a lot. In the examples from the article, revenue growth moving from 15% to 35% changed enterprise value from $35,000,000 to $70,000,000. And a downside-to-upside scenario range moved value from about $10,000,000–$12,000,000 to $28,000,000–$32,000,000.
So here’s the simple rule I use:
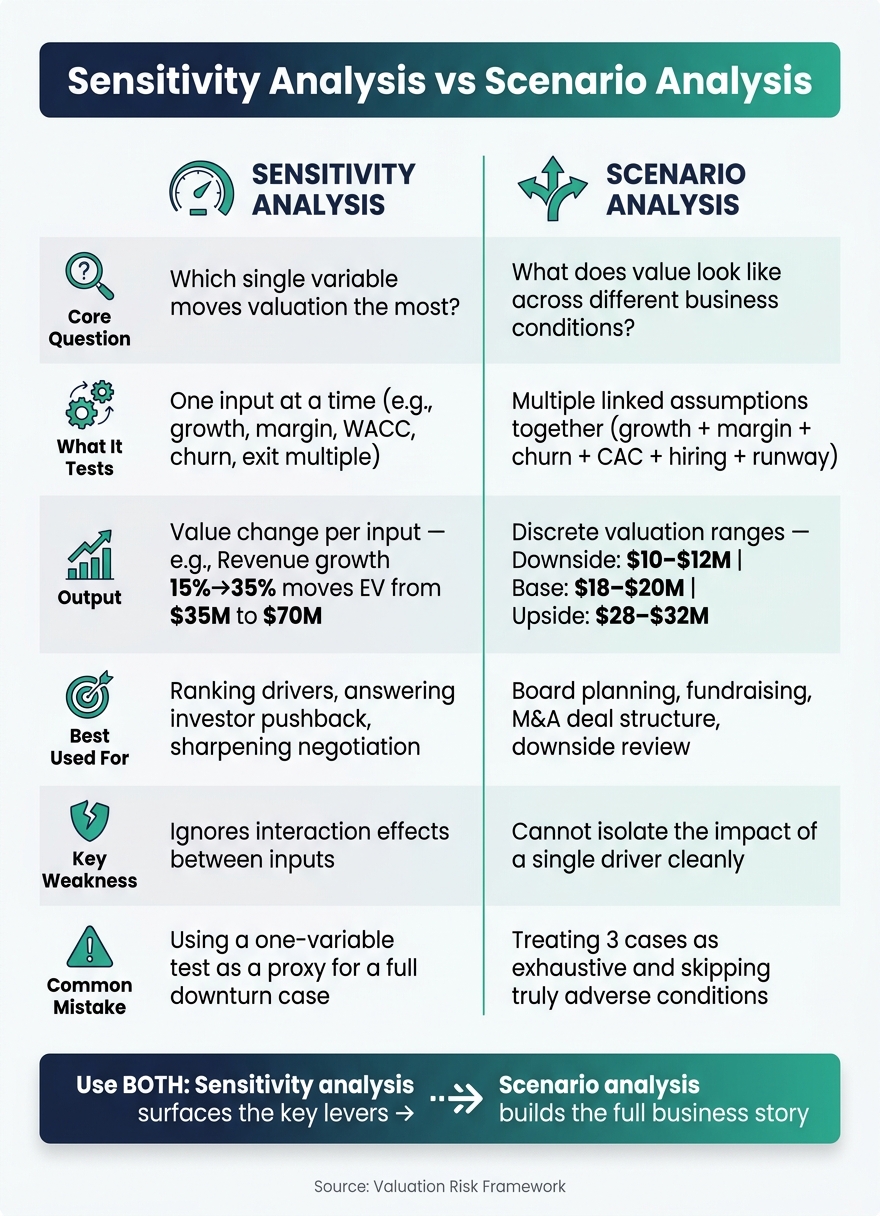
Sensitivity Analysis vs Scenario Analysis: Key Differences at a Glance
| Question | Sensitivity Analysis | Scenario Analysis |
|---|---|---|
| What it tests | One variable at a time | Multiple linked assumptions at once |
| Main goal | Find the biggest value driver | Show a range of business outcomes |
| Common inputs | Growth, margin, WACC, churn, exit multiple | Growth, margin, churn, CAC, hiring, runway, funding timing |
| Output | Value change by input | Base, upside, and downside values |
| Best use | Ranking drivers and answering investor pushback | Board planning, downside review, and business planning |
| Main weak spot | Misses interaction across inputs | Doesn’t isolate one driver cleanly |
If I had to put it in one line: sensitivity analysis explains the levers, and scenario analysis explains the story.
Scenario analysis changes several connected assumptions at the same time to show a full business outcome. Instead of tweaking one input, it asks what happens if growth slows, churn goes up, hiring pauses, and funding gets tougher to get. The result is a valuation range across a base case, upside case, and downside case.
That makes scenario analysis useful when you need a full-picture valuation, not just a one-variable stress test.
The process starts with three clearly labeled scenarios.
The base case reflects the most realistic path ahead based on current pipeline, past performance, and realistic hiring and funding plans. The upside case assumes stronger demand, better execution, lower CAC, and friendlier macro conditions. The downside case models slower growth, higher churn, delayed hiring or product launches, and a tighter funding market.
Each scenario includes linked assumptions for growth, margin, CAC, churn, hiring, and runway. Those assumptions flow into a DCF or operating model, which then recalculates valuation for each case. The output is a range. For example, equity value might land at $10 million to $12 million in the downside, $18 million to $20 million in the base, and $28 million to $32 million in the upside.
Scenario analysis works best when the whole business climate shifts at once, not just one line item. It gives management a clear way to talk through possible futures with boards and investors without acting like one forecast is exact. A McKinsey survey found that 90% of CFOs at leading companies use at least three scenarios in their planning frameworks[1]. That’s not random. Boards want to see downside protection and upside in the same discussion.
It also helps teams make better calls. When leaders can see what aggressive hiring looks like in the downside case - shorter runway, higher burn, lower valuation - versus the upside case, the trade-offs stop feeling abstract. They become concrete.
Take a hypothetical U.S. SaaS company with $2,000,000 in annual recurring revenue (ARR), a 70% gross margin, and a -20% EBITDA margin while it invests in growth. The team builds three scenarios for the next three years.
| Assumption | Downside | Base | Upside |
|---|---|---|---|
| Revenue growth | 15% | 30% | 45% |
| Gross margin (Year 3) | 68% | 72% | 75% |
| EBITDA margin (Year 3) | -10% | +5% | +15% |
| CAC | $7,000 | $5,500 | $5,000 |
| Churn | 18% | 12% | 8% |
| Year 3 ARR | ~$3,000,000 | ~$4,400,000 | ~$6,000,000 |
| Implied valuation | $10–$12M | $18–$20M | $28–$32M |
In the downside case, pricing pressure pulls gross margin down, churn rises, and hiring slows. In the upside case, a successful Series A supports faster sales and product investment, CAC improves, and net dollar retention rises. The jump in value comes from the combined movement in assumptions.
That spread makes one thing clear: valuation can change fast when operating performance and funding conditions move together.
Sensitivity analysis answers a different question: which single assumption moves value most?
Scenario analysis looks at full business outcomes. Sensitivity analysis does something narrower and more precise: it isolates one driver.
You change one assumption at a time and keep the rest fixed. That lets you see how much that single input moves value.
The main drivers to test are the ones that tend to move enterprise value the most: revenue growth, EBITDA margin, WACC, exit multiple, and churn. In most models, these have the biggest effect on DCF and exit-based valuations. A ±1 percentage point change in revenue growth can shift per-share value by roughly 10% to 11%[3]. So if your forecast is off by 2 points, equity value can swing by about ±20% to ±22%. That’s the kind of risk sensitivity analysis is meant to show.
The process is pretty simple.
Pick one input, such as annual revenue growth. Then set a reasonable range using past performance and peer benchmarks. For example, you might test 15% to 35% in 5-point steps. Keep every other assumption fixed: margin, discount rate, exit multiple, and churn. After that, rerun the valuation model at each point and log the enterprise value in USD.
Most teams show the result in a one-way sensitivity table, with each row listing an input value and the matching valuation. A line chart can work just as well. If the line climbs or falls sharply, that driver has more pull on value. In investor or board decks, a valuation bridge - sometimes called a waterfall chart - can show how moving from the low case to the high case on one variable adds or subtracts value. That format is often easier for non-technical audiences to follow.
Sensitivity analysis forces clarity.
When you run one-way tests across inputs like growth, margin, discount rate, churn, and exit multiple, you can compare them side by side and see which one creates the biggest swing in value. That tells you where attention should go.
Say a ±5 percentage point change in revenue growth moves valuation from $35,000,000 to $55,000,000, while the same relative change in EBITDA margin moves it only from $40,000,000 to $45,000,000. The message is plain: growth is the lever that matters most right now.
That makes board and investor discussions much sharper. It also improves model discipline. For instance, saying that a 5% lower churn rate increases valuation by $8,000,000 makes the discussion concrete instead of vague[2].
Take a hypothetical U.S. SaaS company with $10,000,000 in current annual revenue. The base case assumes:
Under those assumptions, the model gives a base-case enterprise value of $50,000,000.
Now run a one-way sensitivity on revenue growth only, while keeping every other input fixed:
| Annual Revenue Growth | Enterprise Value |
|---|---|
| 15% | $35,000,000 |
| 25% (base case) | $50,000,000 |
| 35% | $70,000,000 |
Change just that one input, and enterprise value moves by $35,000,000 across the range. Margin, discount rate, and exit multiple never change. That’s what makes sensitivity analysis so useful next to scenario analysis: you get a clean read on what one variable is doing.
For founders, the choice is pretty simple: are you testing one key input, or an entire future state?
Scenario analysis maps out possible futures. Sensitivity analysis shows which assumptions push valuation the most. One tells a story about how the business could play out. The other pressure-tests a specific input. Both are standard ways to stress-test valuation assumptions, but they solve different problems. Mix them up, and the analysis gets weaker.
| Dimension | Sensitivity Analysis | Scenario Analysis |
|---|---|---|
| Core question | Which variable moves valuation the most? | What happens to the business under different plausible futures? |
| Variable scope | Changes one input at a time, holding all others fixed | Changes multiple linked inputs together like growth, margins, churn, and capital needs |
| Mechanics | One-way or two-way sensitivity tables and tornado charts ranking drivers by impact | Multiple full-model scenarios, such as base, upside, and downside, each with its own coherent set of assumptions |
| Outputs | A table or chart showing how valuation flexes as one driver moves | A small set of discrete valuations, such as Base: $120,000,000; Upside: $180,000,000; Downside: $70,000,000 |
| Best-fit question | What's the single biggest lever on our valuation right now? | Does our business still work if the market turns or growth slows? |
Sensitivity analysis holds everything else equal. Scenario analysis does the opposite on purpose, because in the real world, things rarely move one at a time.
| Scenario Analysis | Sensitivity Analysis | |
|---|---|---|
| Strengths | Captures how linked drivers interact; mirrors real planning discussions; gives boards a valuation range with a narrative attached | Isolates which single assumption matters most; easy to visualize; sharpens negotiation focus |
| Limitations | Hard to isolate individual driver impact; a few cases may miss tail risks | Ignores interaction effects; can't show what happens when multiple things go wrong at once |
| Where it misleads | When teams treat three cases as exhaustive and skip truly adverse conditions | When used as a proxy for a full downturn case by changing only one variable |
The most common mistake is using a sensitivity table as if it were a full recession case. A team might cut revenue growth from 40% to 10% in a one-way test and label that result the downside scenario. But that lower valuation still assumes the same hiring plan, marketing spend, and financing terms as the base case. That’s the catch.
A one-variable sensitivity test can’t reflect several moving parts at once. And when a team uses it that way, it can materially overstate runway and understate risk.
The reverse mistake hurts too. Sometimes leadership asks, “What moves valuation the most?” and the team answers with only scenario cases. The problem there is that the effect of each assumption stays hidden. Investors and acquirers won’t leave it at a high-level downside or upside case. They’ll press on specific drivers.
If you can’t explain that a 1.0x change in exit EV/Revenue multiple moves equity value by about $30,000,000, while a 2-percentage-point change in WACC moves it by only $10,000,000, you’re going into that conversation less prepared than you should be.
Use scenario analysis to frame full future states. Then use sensitivity analysis to rank the drivers that matter most. That distinction shapes when each method fits founder planning, board reporting, fundraising, and M&A.
Use the two tools based on the choice in front of you. Sometimes you need to isolate one input and see what it does. Other times, you need to model a full future state. Knowing which one to use first makes the work sharper.
For founders doing internal planning, sensitivity analysis is usually the best place to start. Map your valuation model to the core drivers - growth, margin, CAC, churn, and the discount rate or exit multiple - then change one driver at a time to see which metrics move enterprise value the most. That ranking shows which KPI deserves a spot in the board deck.
Once you know which drivers matter most, scenario analysis works better for board reporting. A board pack should lay out base, downside, and upside cases tied to revenue, runway, hiring, and margin. In the downside case, growth may land 10 to 15 percentage points below plan, hiring slows, and runway is recalculated to show when cash drops below minimum levels.
Investors will push on valuation, so sensitivity analysis helps you answer those questions up front. Show how implied value changes when ARR growth, gross margin, or the discount rate moves. That makes it easier to explain how much of the valuation rests on growth, margins, or discount rate.
Then scenario analysis carries the operating story. It shows investors that the proposed valuation comes from a base plan with realistic hiring, spend, and margin assumptions - not just an optimistic set of assumptions. Phoenix Strategy Group can help standardize these sensitivity and scenario packs for investor review. That makes the valuation story easier to defend before investor diligence.
In M&A, sensitivity analysis should focus on the assumptions with the most weight in negotiation: synergy realization timing, exit multiples, and retention or churn. A sensitivity matrix across synergy levels and exit multiples helps both sides see where the deal works and where it breaks.
Then scenario analysis sets the broader deal picture. Boards use full-picture scenarios to stress-test deal structure - weighing cash versus stock, adding earn-outs, or tightening retention provisions based on what the downside case shows.
The conclusion turns that rule into a simple choice for day-to-day use.
After comparing purpose, inputs, and outputs, the practical choice is simple: match the method to the question. Sensitivity analysis shows you the biggest valuation driver. Scenario analysis shows what value looks like under different operating states. Use the wrong one, and you'll leave holes in your risk review or planning.
In practice, these two methods work best side by side. Sensitivity analysis brings the key levers to the surface. Even small changes in WACC or terminal growth can shift implied value in a material way[4]. Scenario analysis then builds on that, turning those levers into a full picture of how the business performs when several assumptions move together.
Use the question to pick the tool:
That distinction helps you avoid common modeling mistakes. A sensitivity table won't help much when the board needs a business story. And a set of scenarios can miss the point when an investor wants to know which single driver matters most.
The goal isn't to choose one method and ignore the other. It's to use the right tool before you build the model, whether you're working on planning, board reporting, fundraising, or M&A.
Yes. Using both in the same valuation model gives a more complete view.
Sensitivity analysis tests one variable at a time. Scenario analysis changes several variables at once to model base, upside, or downside outcomes.
Used together, they show which assumptions matter most and how those assumptions can change valuation under more realistic conditions.
Use your own past data and what the market is doing now to set a grounded starting point. Don’t jump to extreme forecasts. Build three cases instead: a base case, an upside case, and a downside case.
Then pressure-test the assumptions with input from different teams and connect each one to core business drivers, like customer acquisition cost or churn. Make changes in small increments, such as ±5%, so you can see how each shift affects the outlook without distorting the model. Just as important, write down the logic behind every key assumption so the forecast stays transparent and easy to defend.
Start with the variables that have had the biggest historical effect on cash flow and valuation, especially sales volume, pricing, and direct costs.
Then focus on the inputs tied to your current goals, like growth rates, customer churn, and customer acquisition costs. Use sensitivity coefficients to spot which variables drive the most volatility and map to your biggest operating or market risks.