Published on
August 15, 2026


If I’m selling a U.S. renewable asset, I should not rely on one valuation method. DCF tells me what the project’s cash flow may support, while market comps show what buyers have been paying in recent deals. In most sale processes, I need both.
Here’s the short version:
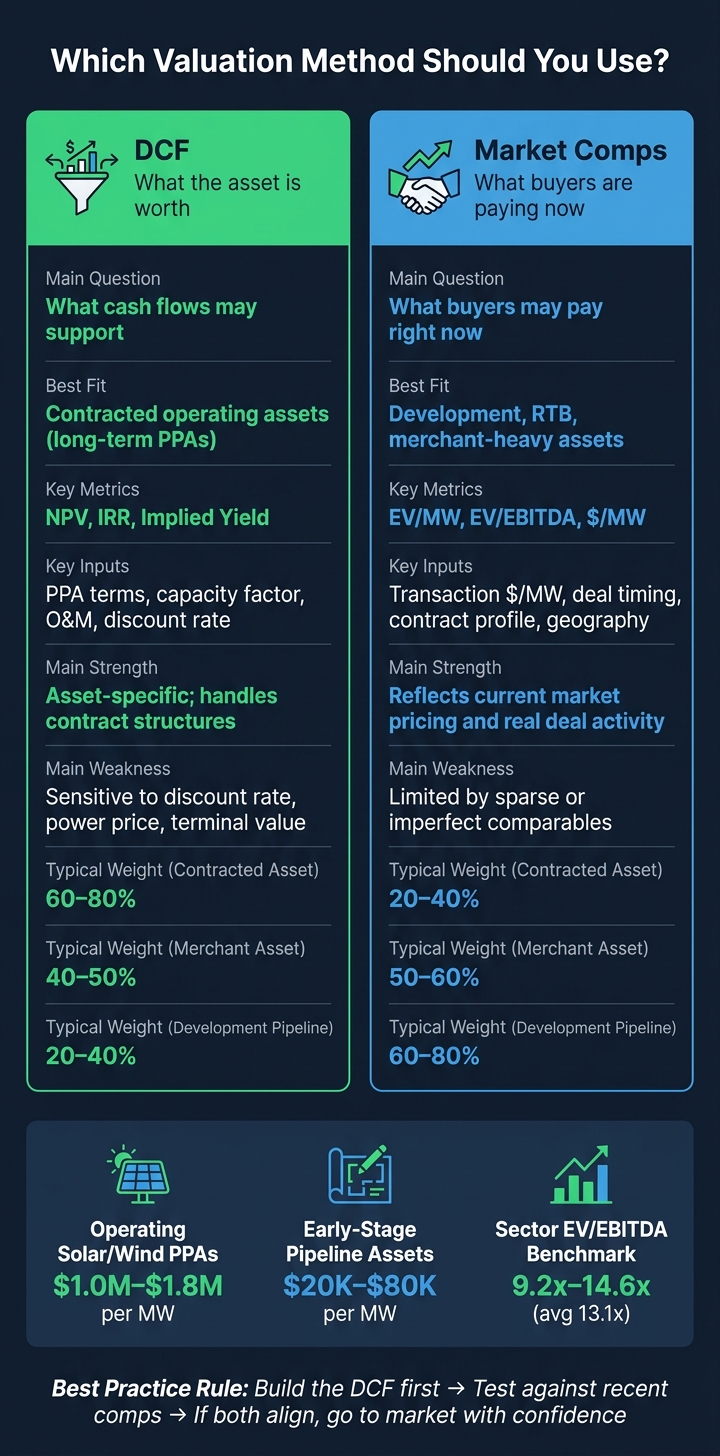
DCF vs Market Comps for Renewable Asset Valuation
| What I’m checking | DCF | Market comps |
|---|---|---|
| Main question answered | What cash flow may support | What buyers may pay now |
| Best fit | Contracted operating assets | Development, RTB, merchant-heavy assets |
| Common metrics | NPV, IRR | EV/MW, EV/EBITDA, $/MW |
| Main weak spot | Assumption risk | Poor comp selection |
| Best use in a sale | Base valuation case | Market check |
My takeaway is simple: I’d build the DCF first, then test it against recent U.S. comps. If both point to the same range, I can go to market with more confidence. If they don’t, I should fix the gap before buyers do.
In a sale process, DCF is the seller’s internal value case. It works best when project cash flows are visible and steady. The method values an asset by discounting projected cash flows back to present value. It’s used a lot because it can handle PPA, feed-in tariff, and merchant revenue across the full life of a project.
DCF makes the most sense when cash flows are predictable and backed by solid records. It also fits sum-of-the-parts work well: run separate DCFs for each asset bucket, then roll them up into one portfolio view.
It gets tougher to defend when a project is merchant-heavy or still in early development. If cash flows are less certain, you need a market cross-check.
A DCF model is only as good as the assumptions inside it. For U.S. solar and wind assets, the main inputs include contracted revenue, such as PPA price in $/MWh, escalators, and contract term. You also need merchant revenue assumptions adjusted for basis and congestion, along with net capacity factor, curtailment, and degradation. For modern solar modules, degradation is usually 0.25% to 0.5% per year.
On the cost side, the model should include fixed and variable O&M, land lease, insurance, property taxes, interconnection and wheeling costs, and replacement schedules. For solar, that may mean inverter replacements in years 10–15. For wind, it can include gearbox or blade work.
Tax benefits need to be modeled with care. The ITC is typically 30% of eligible project costs for qualifying solar and wind projects, though the depreciable basis must be reduced by 50% of the credit amount.[4] MACRS accelerated depreciation adds more value in the early years. DOE materials show that tax incentives plus depreciation can reduce capital costs by roughly 40%–50%, depending on the asset type and deal structure.[2][3] Those items need to flow through the model the right way and line up with the financing structure.
For fully contracted projects, sellers often use a mid- to high-single-digit nominal after-tax equity discount rate. Merchant or hybrid assets usually need higher rates because cash flows move around more. One mistake shows up again and again: using nominal discount rates with real cash flows, or real rates with nominal cash flows. That mismatch can distort the valuation fast.
Buyers will pressure-test all of these assumptions against operating history, tax setup, and financing terms.
The most common DCF mistakes are also pretty avoidable. And they usually create the same problem: a wider gap between seller value and buyer underwriting.
Overstated power prices are a frequent one. Sellers may rely on rosy merchant curves or skip over congestion and basis risk, which pushes revenue and NPV too high. Buyers tend to spot that fast. Capacity factor assumptions can also drift out of line, especially when projected output looks better than engineering reports or actual operating data.
Merchant tail assumptions need close attention. If a model carries near-PPA pricing deep into the post-contract period, that’s a red flag. Long-term merchant pricing should move toward conservative expectations, not stay pinned to current spot or forward levels. Terminal value can also get overstated, especially when a seller assumes strong residual value but leaves out decommissioning costs, repowering costs, or re-permitting risk.
Tax modeling is another place where errors get expensive. Misapplying ITC or PTC, using the wrong MACRS schedules, or double-counting depreciation can overstate value by tens of millions of dollars on utility-scale portfolios. Internal review and sensitivity testing can catch those issues before buyers do.
That’s why sellers rarely lean on DCF by itself in a sale process.
DCF points to intrinsic value. Comps show what buyers are paying right now.
That difference matters. Comps lean on recent transactions or public market data to reflect current pricing, financing conditions, and risk appetite. They do not measure project cash flow the way a DCF does. In U.S. renewables, those two numbers can land pretty far apart. That’s why comps are often more useful when cash flow is thin, uneven, or just too early to model with much confidence.
The main metrics are pretty straightforward:
Each one fits a different asset stage. A broad renewable sector benchmark reported EV/EBITDA at around 13.1x, with a regional range of 9.2x to 14.6x.[5] Operating solar portfolios with long-term PPAs have traded at roughly $1.0 million to $1.8 million per MW, while early-stage development assets can fall as low as $20,000 to $80,000 per MW.[8][1] From there, the job is simple in theory and tricky in practice: match those metrics to deals that are actually comparable.
Comps tend to work best when a DCF is hard to defend. That usually means development-stage pipelines, ready-to-build (RTB) assets, and portfolios with little operating history. If a project doesn’t have years of performance data or long-term contracted cash flows, a DCF can start to feel like guesswork. Comps give both sides a shared pricing language.
They also help when the market is moving fast. KPMG reported a 384.6% rise in deal value in H1 2025 versus H2 2024.[6] That kind of jump shows how fast pricing can change in a short stretch. In a market like that, an old comp can mislead you in a hurry. The strength of the analysis comes down to the screening.
A comp only helps if it’s genuinely comparable. That means filtering by technology, stage, market, interconnection, contract exposure, size, and close date.
Time matters more than many sellers think. A deal that closed two or three years ago may reflect a very different interest rate setup, equipment cost base, or policy backdrop. A good working rule is to focus on transactions closed within the last 6 to 18 months and build a set of 5 to 7 high-quality comps instead of leaning on one or two splashy deals.[9]
Contract terms matter just as much. A 15-year investment-grade PPA is not a fair comp for a mostly merchant project, even if both assets use the same technology and sit in the same ISO. On paper they may look close. In pricing, they’re not.
The biggest mistakes with comps usually follow the same pattern. Sellers rely on outdated transactions, blend different technologies or regulatory markets, or use headline multiples without adjusting for stage, geography, or merchant exposure.
Another issue is deal structure. Headline enterprise values can include control premiums, platform value, or earnouts. If you apply those numbers straight to a standalone asset, you can end up with a price target that’s way off. Those items need to be stripped out before the multiple is used.[7][8]
Cherry-picking is another trap. Using too few comps, or picking only the highest-priced deals, creates a skewed view of pricing. That tends to widen the gap between buyer and seller expectations and drag out the sale process. In plain English: bad comps don’t just lead to bad numbers. They can slow the whole deal down.
DCF and market comps answer different questions. DCF is about intrinsic value. Market comps are about what buyers are paying right now.
The simplest way to compare them is through asset stage, data quality, and how much pricing evidence you have.
| Dimension | DCF | Market Comps |
|---|---|---|
| Basis of value | Present value of the asset's own projected cash flows | Prices paid for similar assets in recent transactions |
| Common metrics | NPV, IRR, implied yield | EV/MW, EV/EBITDA, $/MW |
| Best use cases | Contracted operating assets with visible, stable cash flows | Development pipelines, merchant assets, fast-moving markets |
| Key inputs | PPA terms, capacity factor, O&M costs, discount rate | Transaction $/MW, deal timing, contract profile, technology, geography |
| Main strength | Asset-specific; handles contract structures and scenario analysis well | Reflects current market pricing and actual deal activity |
| Main weakness | Highly sensitive to discount rate, power price, and terminal value assumptions | Limited by sparse or imperfect comparables |
| Typical error sources | Discount rate, forward power prices, terminal value, tax modeling | Comp selection, stale deals, geography, contract tenor |
Contracted operating projects are usually the best fit for DCF. The reason is simple: the cash flows are more visible and more stable, so the model has something solid to work with.
Merchant or hybrid assets usually need both methods. DCF helps frame asset-level value, while comps help check whether the risk and pricing line up with the market. It’s a bit like using two maps instead of one when the road gets messy.
Development pipelines lean more heavily on comps. At that stage, cash flows are still too uncertain for DCF to take the lead.
| Method | Main Advantage | Main Limitation | Where Buyers Push Back |
|---|---|---|---|
| DCF | Captures asset-specific value, contract structure, and upside scenarios | Sensitive to assumptions; can diverge from market if discount rate or price curves are off | Discount rate, forward power prices, terminal value, tax equity modeling |
| Market Comps | Grounded in real deal activity; easy to communicate with simple metrics like $/MW | Depends on data quality and true comparability; can miss asset-specific upside | Comp selection, structural differences between deals, timing relative to policy or rate changes |
In practice, buyers are using more than one lens. They often triangulate DCF, trading comps, and precedent transactions. So if you're selling, it’s not enough to show intrinsic value alone. You also need market proof.
The next step is reconciling any gap between the two methods.
Use DCF as the base case, then use comps as a market check. In practice, that means building the DCF first and making sure it stands up on its own.
Start by organizing your operating, contract, tax, and financing data in a clean data room. Clean data makes the model easier to defend and helps diligence move faster.
Once the data is in order, build a project-level DCF over the asset life or contract term. Apply separate discount rates to contracted cash flows and the post-contract merchant period. Then run sensitivities on the main drivers: discount rate, production, power price, and curtailment. That gives you a value range, not just one number.
After that, gather recent comparable transactions with a similar profile. Focus on deals with similar technology, region, contract setup, and stage. Then compare the implied metrics - such as $/MW, EV/EBITDA, and equity IRR - against what your DCF shows. If the two don’t line up, dig into the drivers before going to market.
If the DCF and comps do not align, stop before pricing the asset.
A gap between DCF and comps is common. The usual causes are aggressive production, stale comps, contract differences, congestion risk, and tax equity structure.
Before changing your price, run a diagnostic. Re-run the DCF with more conservative inputs. Refresh comps to the latest quarter and break them out by contract type and region. For example, applying CAISO-based valuations to a congested ERCOT project will give you a misleading benchmark. If the gap still shows up across multiple data points after that review, it may point to a market dislocation instead of a model problem. If that happens, document it clearly and be ready to walk buyers through it.
The table below shows how to weight each method based on the asset stage and the quality of the data you have:
| Asset Stage | DCF Weight | Comps Weight | Rationale |
|---|---|---|---|
| Contracted operating (long-term PPA, investment-grade offtaker) | 60–80% | 20–40% | Stable, visible cash flows make DCF the primary tool; comps validate discount rate and IRR |
| Merchant or partially contracted | 40–50% | 50–60% | Future prices are uncertain; comps anchored in similar merchant exposure constrain optimistic DCF scenarios |
| Development or pipeline (pre-COD) | 20–40% | 60–80% | Limited operating data makes DCF highly assumption-driven; $/MW pipeline comps are more reliable |
| Strategic or portfolio sale | DCF sets the floor | Comps reflect platform premiums and synergies | Buyer synergies and platform premiums shift the balance; DCF still anchors minimum value |
Once valuation is set, buyers will test every assumption in diligence. Sellers that go to market without reconciling DCF and comps often run into late-stage price cuts or broken processes.
Phoenix Strategy Group can help sellers build an auditable model, line up operating data, tax treatment, and debt schedules, and prepare the valuation memo and buyer Q&A that diligence will test.
DCF shows what an asset is worth. Comps show what buyers are willing to pay right now. Which method matters more depends on the asset’s stage and how solid the cash flow data is.
For contracted, operating assets with long-term PPAs and a steady operating record, DCF is usually the better anchor. It maps project cash flows in a way broad market averages can’t. That means it can reflect contract terms, operating history, and tax structure with much more precision.
For merchant, partially developed, or early-stage assets, comps tend to matter more. In those cases, buyers are often pricing risk, timing, and market conditions more directly.
The best approach is simple: use DCF as the anchor and comps as the market check. When both point to the same range, pricing is easier to defend. When they don’t, it’s a sign to go back and test the assumptions before launch. That gives you a cleaner range going into diligence.
It depends on the asset’s stage, the data you have, and how mature the market is.
Start with market comparables when you’re valuing standardized assets or working in mature markets with strong recent transaction data. That approach gives you a market-based view of what buyers are paying right now.
Start with DCF for operating projects with stable revenue, thin comparable data, or portfolios that come with asset-specific risks and synergies. In those cases, a cash flow model does a better job of showing what the asset can earn over time.
For the most reliable result, use both. Market comparables help you check current deal benchmarks, while DCF reflects project-specific performance and long-term cash flow.
A renewable asset comp is comparable when the project setup and market conditions are close to the asset you're looking at.
For better accuracy, focus on projects sold in the last 24 months and within 25% of the target asset’s size. That keeps the comparison from drifting too far off course.
You’ll also want to normalize for differences in:
If the data set is thin, widen the geography. Then adjust for local policy, grid connection costs, and resource quality so you’re not comparing apples to oranges.
DCF and market comps often give different answers because they look at value through different lenses.
DCF is forward-looking and tied to the project itself. That means the result depends a lot on the assumptions you use, like the discount rate, future revenue, operating costs, and performance forecasts. Change those inputs, even a little, and the valuation can move fast.
Market comps work from a different angle. They look at recent deals and what buyers have paid under current market conditions. So instead of asking, What should this project generate over time?, comps ask, What has the market been willing to pay lately?
The gap between the two tends to get bigger when markets are volatile, when there aren't many good transactions to compare against, or when a project has features that don't neatly match other deals. That could mean unusual technology, a better site, or contract terms that set it apart.