Published on
September 23, 2026


If I want a forecast I can trust, I don’t look at total pipeline first. I look at five stage metrics: entry rate, exit rate, drop-off rate, stage velocity, and conversion by source or segment.
A big pipeline can still miss target if deals stall, slip, or drop out. That’s the core point. The article shows how I can use stage-level data to check whether revenue is likely to close in the right period, not just at some point later. It also shows why clean CRM data and fixed stage rules matter before I trust any number.
A few points stand out fast:
Here’s the article in plain English:
The article also makes a simple but important point: count and dollar value are not the same thing. I might see a healthy conversion rate by deal count, while larger deals are getting stuck and the dollar view looks weak.
Before any forecast review, I should check:
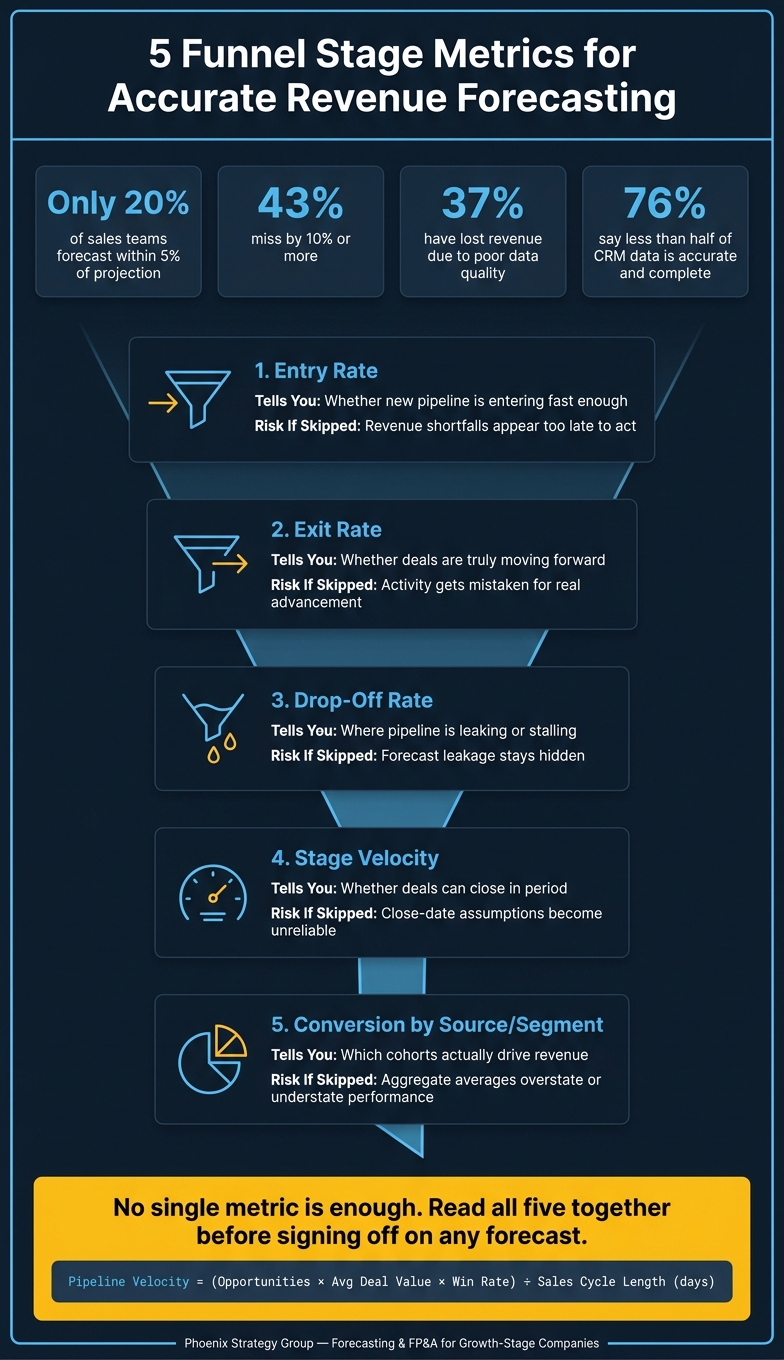
5 Funnel Stage Metrics for Accurate Revenue Forecasting
| Metric | What I use it for | What can go wrong if I skip it |
|---|---|---|
| Entry rate | Check pipeline inflow | I miss an early pipeline shortfall |
| Exit rate | Check forward movement | I confuse activity with progress |
| Drop-off rate | Spot losses and stalled deals | Leakage stays hidden |
| Stage velocity | Check timing to close | Close dates look better than they are |
| Conversion by source/segment | Compare channel and segment quality | Blended averages hide weak spots |
The main takeaway is simple: I should not trust a forecast just because pipeline looks large. I need clean data, fixed formulas, and these five metrics working together to see whether revenue is likely to land on time.
Once your data is clean, you can track the five metrics that connect pipeline movement to revenue timing: entry rate, exit rate, drop-off rate, stage velocity, and conversion by source or segment. Each one points to a different kind of forecast risk. And if you look at only one of them, you can get the wrong read fast.
Entry rate shows whether enough new pipeline is coming in to support your targets. Track it in two ways: opportunities entering the stage and dollars entering the stage.
Only count true new entries. That means leaving out reclassifications, duplicates, reopened deals, and deals that moved backward into the stage. Then compare current entry rates with prior comparable periods, your plan, and normal seasonal patterns.
A jump in entry rate can mean good news. Maybe a campaign worked. Maybe the market got stronger. But it can also be noise, like a bulk CRM update or looser qualification rules. That’s why totals alone don’t tell the full story.
Break entry rate out by lead source, customer type, geography, product line, and owner. That helps you see whether the mix of pipeline lines up with the revenue plan, instead of just looking big on paper.
Once inflow looks healthy, the next step is simple: are deals moving ahead, or slipping away?
A single exit-rate number can hide a mess. Split exits into clear categories:
| Exit type | Formula |
|---|---|
| Stage advancement rate | Opportunities advancing to next stage ÷ opportunities entering current stage |
| Closed-won exit rate | Opportunities closed won from stage ÷ opportunities entering stage |
| Drop-off rate | Closed-lost, disqualified, or abandoned exits ÷ opportunities entering stage |
| Backward-movement rate | Opportunities moved to an earlier stage ÷ opportunities entering stage |
Here’s why this matters. A stage with a 60% exit rate might look fine at first glance. But that number means very different things depending on what sits underneath it.
If 50% move forward and 10% are lost, that stage is moving well. If 15% move forward and 45% are lost, you’re looking at forecast leakage.
Drop-off rate is the metric that shows that leakage most directly. To make it useful, standardize your reason codes. Use labels like budget unavailable, no decision, competitor selected, poor fit, timing delayed, duplicate, disqualified, customer churned, or data or process error. Without that structure, you end up with a pile of vague notes and no pattern you can trust.
Also flag deals that show warning signs, such as:
Stage velocity shows how fast deals move. That matters because a deal that closes eventually is not the same as a deal that closes inside your forecast window.
Track median days in stage, average days in stage, and total sales-cycle length. For forecasting, use the median. It gives you a cleaner view of what’s typical. The average still has a place, especially when you’re dealing with long-tail deals or trying to plan team capacity.
Conversion by source or segment is where forecast assumptions often start to wobble. Use cohorts for this. Group opportunities by first-stage entry date, then track each group through the same time window. If you compare a finished cohort with a recent one that’s still moving through the funnel, the math will point you in the wrong direction.
For each source or segment, calculate:
This is where mix matters. One source may drive more opportunities but bring a lower win rate and smaller average deal size. Another may send fewer opportunities, but those deals may convert faster and close at higher values. If your forecast treats all sources the same, it will miss that difference.
The pipeline velocity formula pulls these metrics together:
Pipeline velocity = (number of opportunities × average deal value × win rate) ÷ sales-cycle length in days[1][3]
Use it as a trend metric, not as a benchmark to compare against some outside standard.
Next, standardize formulas and segment cuts before comparing results.
Use the same formulas, in the same way, for every stage and every review period. If the math shifts from one report to the next, your funnel trend becomes hard to trust.
Stage conversion rate = opportunities that reach the next stage ÷ opportunities entering the current stage × 100.
Drop-off rate = opportunities that exit without reaching the next stage ÷ opportunities entering the current stage × 100.
For closed deals, conversion and drop-off should add up to about 100%. Exclude active or unclassified opportunities.[2][6]
Weighted pipeline = sum of opportunity value × stage probability across open deals.
Pipeline velocity = (number of opportunities × average deal value × win rate) ÷ average sales-cycle length.
Pick one time unit and stick with it, whether that's days or months. Use that same unit in both the formula and the report.[2][3]
A common mix-up is treating opportunity count and pipeline value like they're the same thing. They're not. Count conversion shows how well the process is moving. Value conversion shows how much revenue is moving through that process.
Here's where that matters: a stage can post a 50% count conversion rate but only a 25% value conversion rate if the bigger deals are the ones getting stuck. Both figures are right. They just answer different questions.
Before you change any stage probability, set a minimum sample size ahead of time. Use 30+ completed opportunities as a starting benchmark. A segment with 2 wins from 3 opportunities shows a 66.7% observed win rate, but that is not a sound forecasting assumption. If the sample is too small, mark it as low-confidence and use a broader baseline, such as the overall stage rate, until more data comes in.
Once your formulas are locked, break the results into segments. That's how you see where the forecast is strong and where it starts to wobble.
Compare each source and segment with the same measures:
Calculate pipeline velocity separately for segments that have different deal values, win rates, or cycle lengths. Don't force one cycle-length assumption across segments with different sales motions. One blended average will misstate both.[7]
Useful ways to segment include lead source and campaign, customer segment (startup, mid-market, or enterprise), product or service line, geography, new versus expansion business, and deal-size band.
Definitions need to stay fixed. For example, base deal-size bands on the original qualified value, not the current forecast amount. Otherwise, deals can bounce between segments just because the number changed, which muddies the comparison.
Use the segmented results in one stage comparison table for every forecast review.
| Stage | Entry volume | Forward exits | Closed-won exits | Drop-off rate | Conversion rate | Median days in stage | Forecast implication |
|---|---|---|---|---|---|---|---|
| Qualification | 120 | 54 | 18 | 35% | 45% | 9 | Healthy volume, but value-weighted conversion should be checked |
| Discovery | 54 | 30 | 16 | 26% | 56% | 14 | Strong progression; confirm whether cycle time is increasing |
| Proposal | 30 | 18 | 14 | 20% | 60% | 21 | Supports the current probability if the cohort is large enough |
State the denominator under the table. Entry volume is the count entering during the cohort period. Forward exits are opportunities that reach the next stage. Closed-won exits are wins from that same cohort. Drop-off excludes deals still open unless your report uses a separate aging rule.
Also include the as-of date, cohort definition, source extract, stage definitions, probability assumptions, segment filters, and any material changes. If deal sizes vary a lot, add a pipeline value column next to the counts. And if a row has too little data, flag it so no one treats that percentage like a solid signal.
This table should feed the forecast-readiness check, not just sit next to it like a static report.
Once your stage metrics stop bouncing around, use them to make forecast calls.
Before you put any faith in a forecast, every open opportunity should have the basics filled in: current stage, deal value, expected close date, stage probability, source or segment, owner, and the next step with a due date.
From there, sum expected value × stage probability across all open deals set to close during the forecast period. But don’t roll everything into one big number. Split it into four separate views:
| Forecast view | What it includes | Primary use |
|---|---|---|
| Current-period | Open deals closing this month or quarter, weighted by stage probability | Near-term revenue and cash planning |
| Next-period | Open deals closing in the following reporting period | Forward capacity planning |
| Best case | Current-period deals that could close if risks clear | Upside scenario planning |
| Commit | Deals with strong evidence of near-term closure | Executive reporting and operating commitments |
Keep these views separate. A commit forecast should be tighter than a best-case view. And weighted pipeline is just that: an estimate, not a promise. Recalculate all four at least weekly, and update them right away after any big change in stage, value, or close date.[9]
Then ask the next hard question: is that weighted pipeline enough to support the target?
Pipeline coverage ratio = qualified pipeline value ÷ revenue target.[8] On its own, that number can look fine and still mislead you. You have to read it next to win rate, drop-off, and stage velocity.
A rough minimum coverage level is 1 ÷ win rate. Compare the coverage you need with your actual blended win rate before you trust the forecast.[10] If your funnel is converting below plan, that minimum may still fall short.
Work backward from the revenue target. Figure out:
Timing matters here. If stage velocity slows, revenue can slide even when total pipeline value still looks healthy on paper.
Flag any opportunity for replacement-pipeline action as soon as it is:
Each gap needs an owner and a deadline.
If coverage is short or timing slips, log the gap in the variance review.
Forecast variance = actual revenue − forecast revenue. Classify each gap as timing, loss, upside, deal-size change, probability error, data issue, or new pipeline.
Only update probabilities on a fixed lookback window - usually the prior four quarters or the last 12 months. Each time you update the table, document the sample size, date range, and formula used.[5]
Also log every change to stage definitions, CRM sources, probabilities, close-date rules, and cycle assumptions, along with the approver and date.
Before you trust a forecast, make sure the stage definitions are clear and the open-opportunity data is clean. That means every open opportunity should have a current stage, owner, amount, expected close date, source, segment, and next step. Clean open opportunities before review.
Once the data is clean, use the five metrics below as the final sign-off check:
| Metric | What it tells you | Risk if you skip it |
|---|---|---|
| Entry rate | Whether new pipeline is entering fast enough | Revenue shortfalls appear too late to act |
| Exit rate | Whether deals are truly moving forward | Activity gets mistaken for real advancement |
| Drop-off rate | Where pipeline is leaking or stalling | Forecast leakage stays hidden |
| Stage velocity | Whether deals can close in period | Close-date assumptions become unreliable |
| Conversion by source or segment | Which cohorts actually drive revenue | Aggregate averages overstate or understate performance |
Read these metrics together, not one by one. No single metric is enough. A healthy entry rate paired with a rising drop-off rate still points to a leaking funnel. Strong overall conversion can hide a weak outbound channel. And when stage velocity slows, close dates can slip into the next quarter quietly, even if total pipeline value still looks fine on paper.
Use all five metrics before you sign off on the forecast. That early view into forecast risk helps teams make better budgeting, hiring, and cash planning decisions.
Phoenix Strategy Group supports forecasting, FP&A, data engineering, and planning for growth-stage companies.
Start with stage conversion rates. They tend to show friction and bottlenecks sooner than win rates and other lagging indicators.
When you track how deals move from one stage to the next, you can spot weak points early, like poor qualification or messaging friction, before they hit revenue. Focus first on the stage where each leak costs the most.
Clean your CRM until the data is consistent, error-free, and matched with your billing and accounting systems.
Remove duplicate records. Standardize amounts into a single currency, such as U.S. dollars. Require key close fields for every opportunity. If your analytics and CRM numbers don’t line up, audit the tracking. Also include recent activity, like cancellations, so you don’t overstate revenue.
Use pipeline value instead of raw deal count when you forecast revenue.
Deal count still has a job. It can show the health of your sales process and help you spot bottlenecks. But it can also paint the wrong picture if your pipeline is packed with lots of small deals.
A better forecast looks at the dollar value of each opportunity and applies the close rate for its current stage. That gives you a forecast that’s much closer to what may actually come in.
It also helps expose phantom pipeline - deals that seem promising on the surface but probably aren’t going to close.