Published on
August 13, 2026


A good revenue model starts with a simple rule: tie sales to the few inputs that drive them. Instead of guessing “up 10%,” I’d build revenue from leads, conversion, customer count, price, deal size, and churn.
Here’s the short version:
A simple example: if I model 30 leads per week × 50 weeks × 8% win rate × $24,000 average deal size, I get $2,880,000 in new ARR. That gives me a forecast I can explain, check, and update.
I also make sure the model follows timing. A $12,000 annual contract signed on 03/15/2026 is not $12,000 of March revenue. It may be $1,000 per month, depending on the revenue rule I’m using.
If you run a business between $500,000 and $10,000,000 in revenue, this kind of model helps you see what is driving growth, where shortfalls may hit, and whether your sales activity can support the forecast.
| Step | What I focus on | Why it matters |
|---|---|---|
| Define the metric | Bookings, MRR, ARR, or recognized revenue | Stops mix-ups and double counting |
| Map revenue lines | Subscription, services, usage, etc. | Shows what drives each stream |
| Choose drivers | Leads, win rate, ARPU, churn, price | Links forecast to business activity |
| Build the sheet | Assumptions, actuals, outputs | Keeps the model clean |
| Check history | Modeled vs. actual | Finds formula or input issues |
| Run scenarios | Base, upside, downside | Helps with planning decisions |
| Set ownership | Source, owner, update cadence | Keeps the model current |
Below, I’ll keep it simple and focus on the parts that make a revenue model usable month after month.
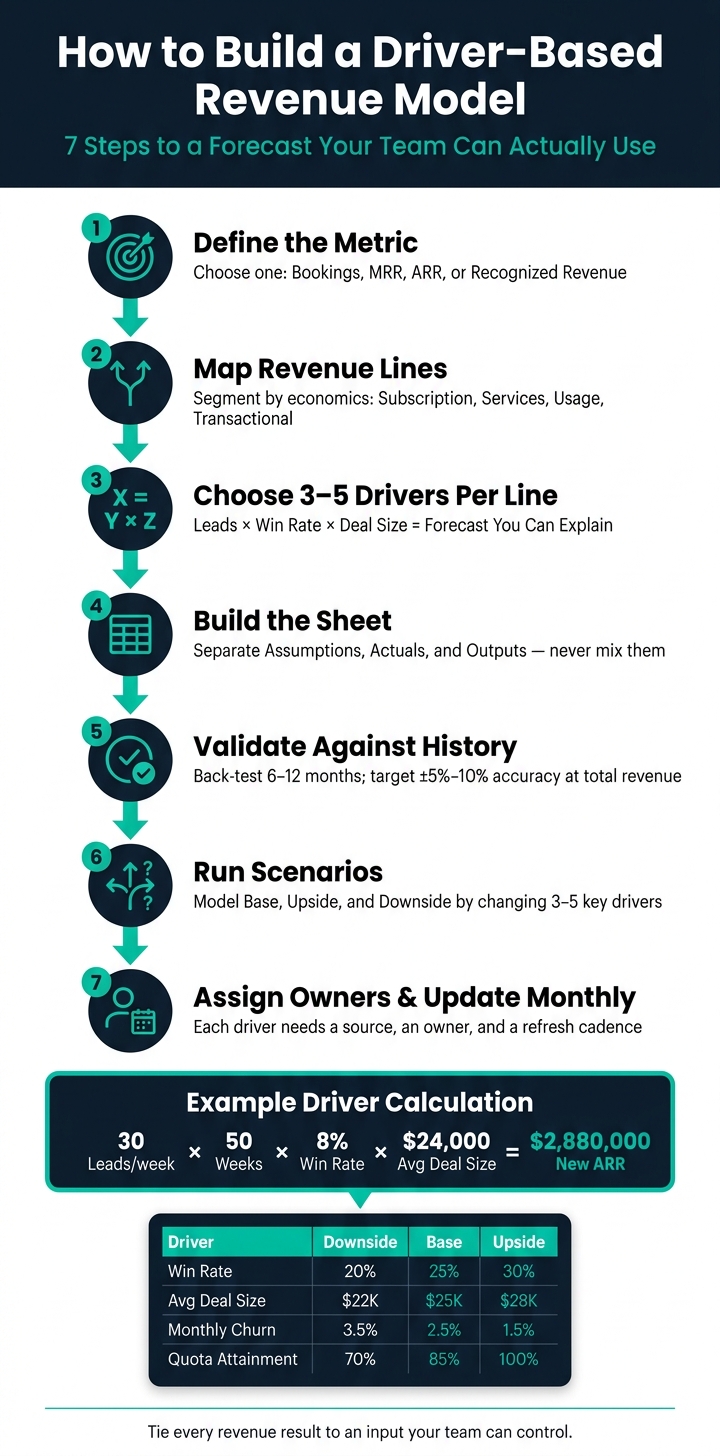
How to Build a Driver-Based Revenue Model: 7-Step Framework
Before you write a single formula, decide what belongs in the model and what doesn’t. That means your revenue streams, customer groups, and channels. Scope comes first because every formula sits on top of that choice. If the revenue line is fuzzy, the model will be fuzzy too.
Once scope is set, map each revenue line to the small set of drivers that move it.
Break revenue into separate lines when the economics are different. Split by how the business works, not just by how finance reports it. For example, a SaaS company may model enterprise subscriptions, self-serve plans, and implementation services as separate lines because each has its own sales cycle and revenue recognition pattern. If you lump them together, you hide what’s pushing growth - or what’s dragging it down.
For each line, pick inputs that sales, marketing, or delivery teams can actually affect. A subscription line may depend on customer count, average revenue per user (ARPU), and monthly churn. A services line may come from billable hours, billing rate, and utilization. A transactional line may depend on order volume, conversion rate, and average order value.
A good rule: use 3–5 measurable drivers for each line.
Once the lines are set, decide how each one will be forecast: top-down, bottom-up, or a mix of both.
Use both. Build with bottom-up inputs, then check the result with a top-down view. Top-down gives you the target. Bottom-up ties the forecast to day-to-day activity.
| Approach | Logic | Key Inputs |
|---|---|---|
| Top-down | Start from market or target, work down | Market size, target share, annual growth rate |
| Bottom-up | Start from operations, build up to revenue | Lead volume, conversion rate, sales capacity, units sold, average selling price |
Start with bottom-up, then compare it against top-down. If your bottom-up model says you’ll grab 20% of the market in 12 months, the top-down check should stop you in your tracks.
Next, turn those inputs into a driver hierarchy.
A driver hierarchy links revenue from a top-line result back to a small number of measurable inputs. In a B2B sales-led model, that might look like Leads × win rate × average deal size = revenue. In a subscription model, it could be customers × ARPU = monthly revenue, with net customer growth coming from new additions minus churn.
Here’s what that looks like with numbers: 30 SDR-generated leads per week × 50 weeks × an 8% win rate × a $24,000 average deal size = $2.88M in new ARR.[2]
That’s the point of the exercise. Every revenue result should tie back to an input a team can influence. Keep each hierarchy short - 3–5 steps per line is usually enough.
Once your driver hierarchy is mapped, build the spreadsheet so people can scan it fast and know where to look. Keep inputs, calculations, and outputs in separate places. When those get mixed together, people stop trusting the model. And honestly, that happens fast.
Your Assumptions tab should store all non-historical drivers you can control or update: pricing by product and segment, lead-to-opportunity rates, opportunity-to-close rates, trial-to-paid conversion rates, churn and retention, seasonality factors, sales ramp profiles, and timing rules.
Put historical actuals on a separate tab, such as Actuals_Revenue, using the same monthly layout as the forecast. Pull that data from your accounting system and CRM, then treat it as read-only. Protect the sheet. Don’t hard-code values into calculation tabs. Add a control table that flags variances above $100.[4][5]
This setup keeps the model clean before you start writing monthly formulas.
Turn the driver hierarchy into monthly equations using one simple pattern: volume × rate.
Here’s the core setup:
| Driver | Formula Pattern | Source | Owner |
|---|---|---|---|
| New customer revenue | New customers × units per customer × price per unit (USD) | CRM + Assumptions tab | VP of Sales |
| Renewal revenue | Renewable ARR (prior month) × renewal rate | Billing system + Assumptions tab | Head of Customer Success |
| Expansion revenue | Active customers × expansion rate × avg. expansion amount | Product analytics + Assumptions tab | Product/CS Leadership |
| Contraction | Active customers × contraction rate × avg. contraction amount (negative) | Billing system / accounting + Assumptions tab | Finance |
| Churn | Prior-period recurring revenue × monthly churn rate (negative) | Accounting + Assumptions tab | Finance |
Reference all rates and prices from the Assumptions tab. That gives you one place to update the model instead of chasing numbers across worksheets.
Next, run a back-test. Feed the model actual historical drivers - real lead volumes, actual churn rates, and real pricing - and see if it recreates what your accounting system recorded.
Build a variance table by segment using:
The model needs to match actuals before you use it for forecasting. If variances are above 5%, flag them and fix the cause before moving forward.[3] Once the back-test works, roll the monthly drivers into company totals.
Use the driver hierarchy from the prior section to fill in each monthly row. The aim is a clean setup that rolls segment-level results into a summary leaders can use. Put one column per month across the full forecast horizon, and add rows for each revenue segment - Subscription SMB, Subscription Mid-Market, Services, Usage-based, and so on. Add a period flag to show whether a month is actual, forecast, or partial.
As each month closes, update the Last Actual Month control in your assumptions tab, import the actual revenue, and mark that column A. Then the rest of the rollup updates on its own.
The monthly table is where the driver hierarchy turns into output. For a single subscription segment, it can look like this:
| Month | Start Cust | New Cust | Churn Cust | End Cust | ARPA ($) | Revenue ($) |
|---|---|---|---|---|---|---|
| Jan-2026 | 100 | 15 | 5 | 110 | 120.00 | 13,200 |
| Feb-2026 | 110 | 20 | 6 | 124 | 120.00 | 14,880 |
| Mar-2026 | 124 | 22 | 7 | 139 | 125.00 | 17,375 |
Each row should link straight back to assumptions for conversion, churn, and pricing. Then sum segment revenue by month and roll those monthly totals into quarterly and annual summaries on a separate tab.
Once monthly revenue is working, bring pipeline and capacity into that same timeline.
Revenue should come from activity, not from numbers typed in by hand. The chain - drivers → pipeline → bookings → recognized revenue - should be clear in the model.
Start with pipeline creation. How many qualified opportunities entered the funnel each month, and what was their dollar value? Apply stage probabilities, then shift expected bookings by the average sales cycle so they land in the right close month.[10][6]
Next, add sales capacity as a gut check. Model rep capacity as full quota × ramp %.[7][9] Sum that across the team and compare it with your pipeline-based bookings estimate. If the pipeline math shows $120,000 in expected March bookings but rep capacity is $75,000, the forecast is too high and needs a fix - either more pipeline or more reps.[8]
After you forecast bookings, convert them into recognized revenue based on contract term and recognition rules. A $12,000 annual subscription booked on 03/15/2026 should be recognized monthly over its term, not all at once in March.[6] Build a deferral schedule that ties each contract’s close date and term to its monthly recognition pattern. That schedule belongs inside the monthly rollup, not off to the side as an accounting footnote.
With monthly rollups in place and sales activity tied to revenue timing, the next job is simple: make sure the model matches what’s happening in the business and still works when conditions shift.
Once the monthly rollup is working, test how changes in key drivers affect revenue. Back-test the last 6–12 months first. Then use that same setup to run Base, Upside, and Downside cases.
Start with historical months. Plug past driver values into the assumptions tab - win rate, average deal size, churn, and rep productivity - and forecast those same months. Before you use the model for hiring or budget calls, aim for ±5%–10% accuracy at total revenue and ±10%–15% by major segment.
After the back-test looks good, build a scenario control panel right on the assumptions tab. A basic drop-down with Base, Upside, and Downside is enough. For each case, change only 3–5 high-impact drivers.[3][11] For example:
| Driver | Downside | Base | Upside |
|---|---|---|---|
| Win rate | 20% | 25% | 30% |
| Average deal size | $22,000 | $25,000 | $28,000 |
| Monthly churn | 3.5% | 2.5% | 1.5% |
| Rep quota attainment | 70% | 85% | 100% |
Use IF or CHOOSE so you can switch scenarios without touching the core formulas. Each scenario should connect to a clear decision. Maybe Upside supports new hiring. Maybe Downside means pulling back spend.[11][13]
Once those scenarios are set, give each driver an owner and a refresh schedule.
Create a driver dictionary tab with every major input, its exact definition, its data source, and the person who owns it. For example: "Win Rate: Closed-won deals ÷ total closed opportunities in the last 90 days; Source: CRM report; Owner: VP Sales." Pull pipeline and win-rate data from CRM, MRR and churn from billing, and recognized revenue and discounts from finance systems.[1][12]
A monthly update cadence keeps the model tied to operating data. After each month closes, refresh assumptions, run variance analysis, and log driver changes. That way, the model stays lined up with actual performance instead of drifting over time.[14][15]
If your team is stretched thin, Phoenix Strategy Group can handle the model and the monthly refresh process while helping your team learn how to run it.
The model matters only if people use it to make monthly decisions. A good driver-based model ties revenue to inputs your team can control, rolls up monthly, and improves over time through actuals, ownership, and scenario review.
Start with your current Monthly Recurring Revenue (MRR). That gives you a steady baseline for the income you can reasonably expect month to month.
Then build on it with the main drivers of monthly revenue change:
This keeps your forecast tied to what’s happening in the business, not just best-case guesses.
Focus on the metrics that have the clearest link to revenue and match where your company is right now. Start with historical data and look for the variables that have moved the needle most - like acquisition, churn, expansion, or pricing.
For SaaS, common drivers include MRR, churn, CAC, and ARPU. A bottom-up model built from lead volume, conversion rates, and sales cycle length is usually easier to explain, check, and update over time.
Use a monthly refresh cycle as your baseline. Swap forecasts for actuals, run a variance analysis, and update your assumptions if results drift by 5% to 15%.
Then add a few lighter checkpoints around that core rhythm:
This setup gives you a steady planning cadence without waiting too long to fix course when the business shifts.