Published on
September 2, 2026

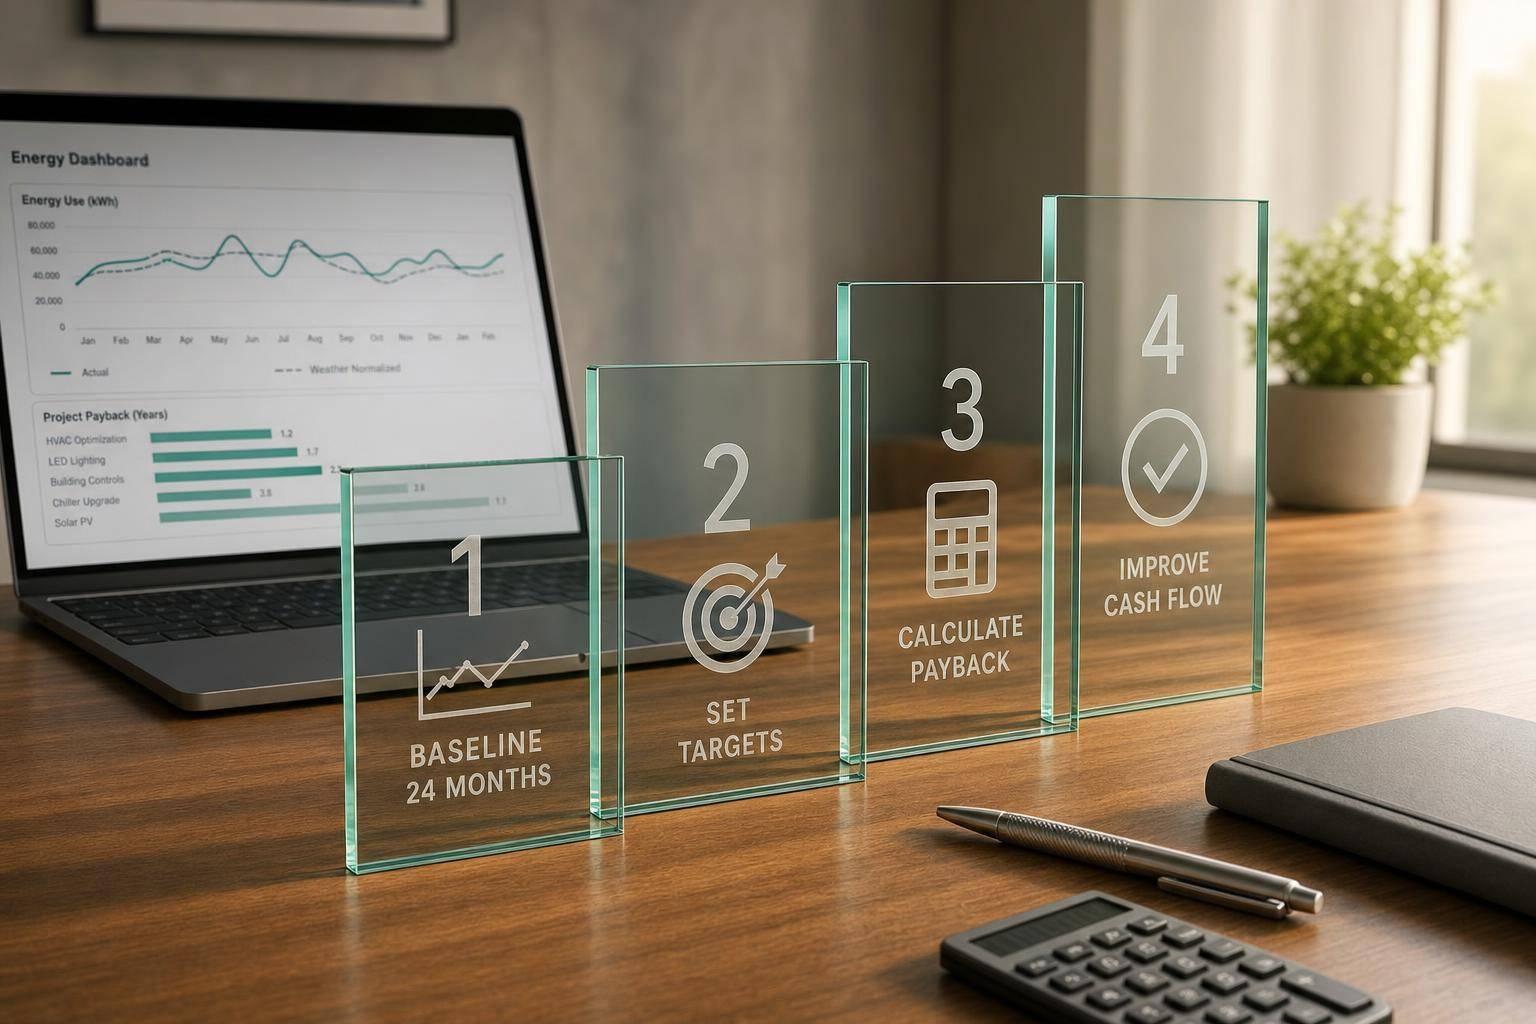
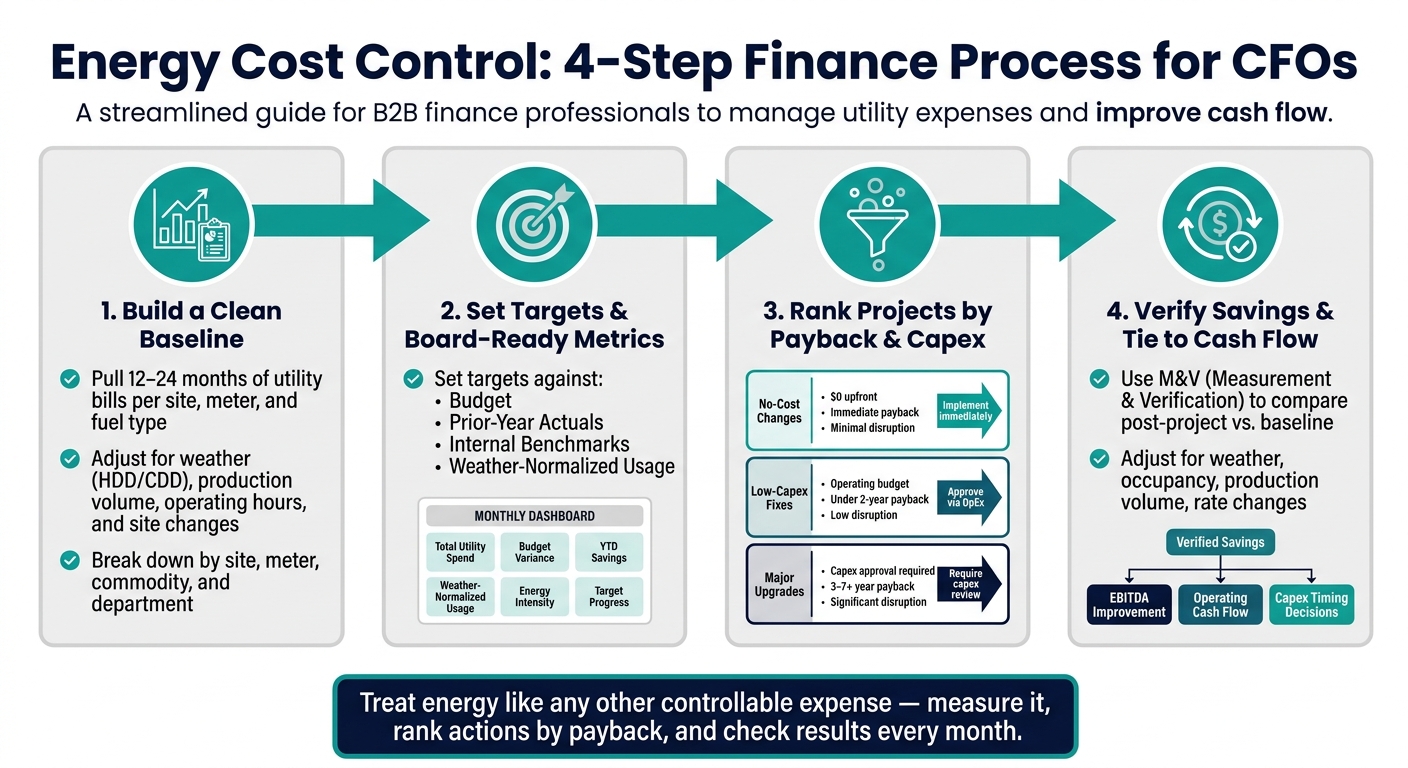
If I want energy costs under control, I need more than lower bills. I need a finance process, often managed by a fractional CFO. The article boils it down to four steps: build a clean 12–24 month baseline, set monthly and annual targets, rank projects by payback and upfront cost, and verify that savings show up in cash flow and EBITDA.
Here’s the short version:
A few points stand out. First, many savings come from no-cost or low-cost changes, not just equipment swaps. Second, a project with a 3–7+ year payback should not be judged the same way as a schedule change that costs $0. Third, if savings are not checked after launch, they are just estimates.
Quick comparison
| Area | What I look at | What I need to decide |
|---|---|---|
| Baseline | 12–24 months of bills, weather, output, hours | What “normal” spend looks like |
| Targets | Budget, prior year, normalized usage | Whether costs are on plan |
| Project screen | Payback, upfront spend, savings confidence, disruption | Which projects go first |
| Savings check | Baseline vs. actual, rate and weather adjustments | Whether savings hit P&L and cash flow |
In short: treat energy like any other controllable expense - measure it, rank actions by payback, and check results every month.
Energy Cost Control: 4-Step Finance Process for CFOs
Pull 12–24 months of utility bills for every site, meter, and utility type. This helps you separate normal usage from odd spikes and seasonal changes. Once you’ve done that, you have a clean baseline to use when setting targets.
Normalize the data for factors outside your control, such as HDD, CDD, production volume, operating hours, and site changes.
Slice the spend into the views finance teams care about most.
| Breakdown Layer | Why It Matters |
|---|---|
| Site / location | Shows which facilities are driving utility spend |
| Individual meter | Shows where usage is happening in more detail |
| Commodity | Highlights electricity, natural gas, and other utility cost patterns |
| Department | Ties the spend to the department responsible |
Review billing variances and usage patterns to spot energy waste, metering problems, and cost leakage. Start with the biggest variances first. In many cases, that’s where the fastest savings show up.
Use this baseline to set cost targets and board-ready metrics.
Once you’ve set the baseline, the next step is simple: turn it into targets and reporting the board can use. Start with 12 to 36 months of utility history to build a multi-year baseline.
Set energy targets using four inputs: the corporate budget, prior-year actuals, internal benchmarks, and weather-normalized usage. Each one tells you something different.
Budget variance shows whether spending is above or below plan. Year-over-year (YoY) comparison helps you see where things are headed. Weather-normalized usage helps separate actual efficiency gains from swings caused by heating and cooling demand.
For companies with multiple sites, it’s better to set targets at the site level first and then roll them up. That way, you can compare locations more fairly instead of mixing very different operating conditions into one number.
After the targets are in place, put them into a dashboard for monthly review. The board doesn’t need pages of utility detail. They need one page that answers four questions: spend, budget variance, target progress, and change from baseline.
A practical one-page dashboard should include total utility spend, budget variance, year-to-date savings, weather-normalized usage, energy intensity, and target progress. Keep it short, update it every month, and make it easy for fractional CFO services or internal finance teams to spot variances early while keeping monthly and annual targets in view.
| Dashboard Metric | What It Shows |
|---|---|
| Total utility spend | Actual cost for the period |
| Budget variance | Over or under plan |
| Year-to-date savings | Verified savings versus baseline |
| Weather-normalized usage | Usage adjusted for HDD and CDD |
| Energy intensity | Energy use relative to the business |
| Target progress | How current results compare with the goal |
Use these targets to screen projects by impact, payback, and capex.
Once your targets are set, rank projects by two simple things: how fast they cut costs and how much money they need upfront. Use budget variance and energy intensity from the dashboard to see which items should rise to the top.
Start with no-cost and low-capex work. Move to major upgrades only when the savings are clear, the timing works, and cash flow can handle the spend.
Before approving any energy project, place it into one of three buckets:
This step keeps the process clean. It also helps finance avoid treating a thermostat schedule change the same way it treats a full HVAC replacement. Those are not in the same league.
Score each project across four factors: payback period, upfront capex, savings certainty, and operational disruption. Projects with short payback, low capex, high savings certainty, and little disruption should come first. Major upgrades should move ahead only when the payback clears the threshold and cash flow supports the timing.
| Factor | No-Cost Changes | Low-Capex Fixes | Major Upgrades |
|---|---|---|---|
| Payback period | Immediate | Under 2 years | 3–7+ years |
| Upfront capex | $0 | Operating budget | Capex approval required |
| Savings certainty | High | High | Moderate - requires verification |
| Operational disruption | Minimal | Low | Significant - plan carefully |
After approval, measure actual savings against the baseline so finance can connect results back to cash flow.
Once a project gets approved, the job isn’t done. You still need to show that the savings appeared in actual spend. If you don’t verify them, they’re still just claims on paper.
Use Measurement and Verification (M&V) to compare post-project utility use against the documented baseline. Then adjust for weather, occupancy, production volume, and rate changes. That helps separate real savings from day-to-day operating noise.
Review baseline-to-actual variance on the same schedule finance already uses. If actual savings land below the business case, dig into the reason. The project may have underperformed. The baseline assumptions may have been wrong. Or operating conditions may have shifted. Once the savings are verified, they should flow into the cash flow forecast.
Lower utility spend improves EBITDA and operating cash flow. For CFOs, that turns energy efficiency into a direct cash flow lever tied to payback, capital allocation, and capex timing.
A simple reporting view should show:
That makes it much easier to connect operating changes to financial results and check whether the program is producing real value. But that only works if the numbers get reviewed on a fixed schedule.
Bring energy review into the monthly close. Reconcile savings against the baseline, and flag projects that are off plan. Give one owner to operations and one owner to finance reporting so accountability stays clear.
As the company adds sites or facilities, utility tracking and savings validation get tougher to manage by hand. A structured FP&A process can pull utility data, project status, and cash flow forecasting into one finance-ready view.
Energy efficiency works best when you treat it like a repeatable finance process, not a one-off project. One owner should track the baseline, targets, approvals, and savings on the same monthly schedule.
Stick with the same sequence each time: baseline first, targets second, project ranking before approval, and post-project verification after launch. That kind of discipline turns energy savings into a repeatable cost-control lever.
Still, a process on paper isn't enough. Someone has to own it. Clear ownership keeps monthly reviews on track as the business grows.
Separate fixed base charges from variable usage fees with regression analysis or the High-Low Method. That helps you see the variable cost per unit by looking at your highest and lowest activity levels.
Then normalize costs against business drivers instead of looking at raw totals alone. For example, track energy per $1,000 of revenue or per unit produced. During monthly close, reconcile utility data against occupancy, headcount, and production volume.
Don’t lean on simple payback alone. It stops the clock once the upfront cost is paid back, which means it can miss a project’s total financial upside.
Use IRR and NPV to judge long-term returns. A payback period, like 5 to 7 years for commercial solar, is still useful for checking near-term cash strain. But that number only tells part of the story.
The smarter move is to compare projected energy savings against financing costs so you can see whether the project delivers net-positive cash flow over time.
Start with a baseline built from utility bills that use reconciled billing periods. From there, track month-over-month changes in energy use with a clear audit trail linked to source documents and approvals.
Then move those gross utility savings into your financial model and translate them into after-tax cash flow and EBITDA impact. Check savings against actual utility data, reconcile assumptions before board reporting, and use board-ready dashboards to support forecasting and variance review.