Published on
August 9, 2026


If your ESG numbers can’t be traced, approved, stored, and tied back to finance, they can fail under SEC review.
I’d boil the article down to four control gaps that financial institutions need to fix now: source mapping, approvals, evidence storage, and finance/risk linkage. That matters more now because climate metrics can fall under ICFR and climate narrative disclosures can fall under DCP, which puts ESG reporting much closer to financial-reporting standards.
A few points stand out right away:
So if I were summarizing the fix in plain English, it would be this:
| Control area | Main issue | What to put in place |
|---|---|---|
| Source traceability | Teams can’t show where a metric came from | Metric-to-source registry, lineage records, pre-reporting data checks |
| Governance and approvals | Review is informal and hard to prove | Maker-checker workflow, role separation, approval records |
| Evidence and access | Files sit across inboxes and drives | Single repository, role-based access, audit logs, read-only filing snapshots |
| Finance and risk linkage | ESG figures don’t match finance or risk reporting | Reconciliations to GL, payroll, sub-ledgers, and risk models |
Bottom line: I see the article as a push to treat ESG reporting more like financial reporting. Not with extra noise, but with clear ownership, retained proof, and repeatable controls that can stand up to testing.
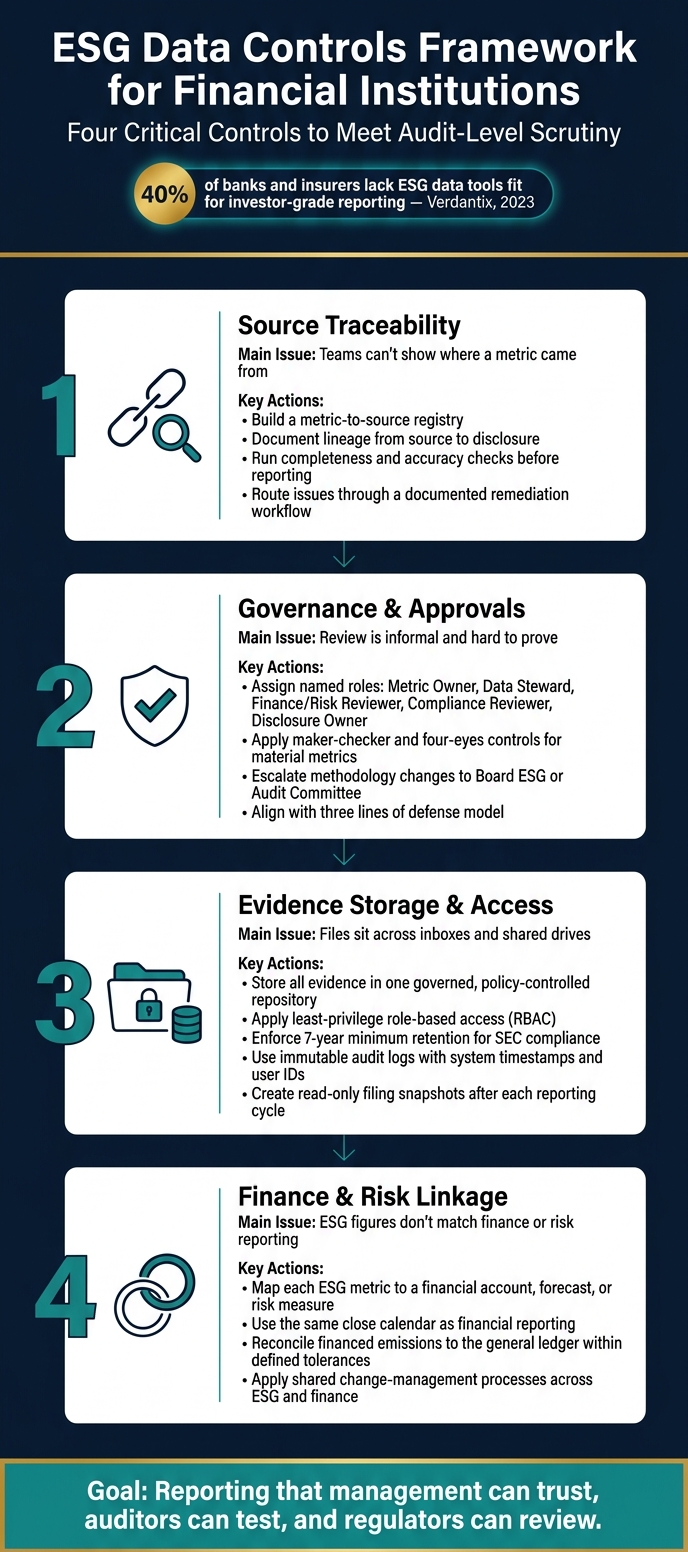
ESG Data Controls Framework for Financial Institutions
The first fix is traceability. Most financial institutions pull ESG data from several places at once: internal systems, client questionnaires, third-party vendor feeds, and public disclosures. The problem starts when that trail gets fuzzy. Teams may have the final metric, but they can’t show exactly which source fed it.
That’s where validation needs to look more like an audit. In plain English, that means identifying risk, testing the data in detail, and reviewing the evidence behind it.
Start with a source registry. Each ESG metric should link back to its source, owner, calculation method, refresh rate, and reporting requirement.
The lineage record should also show how the data moves from source to disclosure. That includes any transformations, aggregations, or manual adjustments made along the way. If someone changes a number by hand, that change shouldn’t vanish into thin air.
Once the source chain is documented, check the data before it moves into reporting. Before disclosure drafting begins, run checks for completeness, accuracy, and reconciliation.
If something doesn’t line up, send it through a documented remediation workflow before sign-off. The point is simple: catch the problem before the annual report disclosure is locked in.
These controls depend on the source type.
| Data Source | Main Control Focus | Why It Matters |
|---|---|---|
| Internal systems | Map source fields to reported ESG metrics and document ownership | Internal data needs a clear trail from source to disclosure. |
| Client questionnaires | Validate responses and retain evidence of review | Self-reported inputs should not move into reporting without review. |
| Third-party vendor feeds | Review methodology and reconcile to supporting records | The reporting team needs to know how the feed was produced and checked. |
| Public disclosures | Record the version and date used | Public disclosures can change, so the version being used must be clear. |
Once source lineage and data checks are in place, the next layer is approval authority. Put simply: who owns each ESG number, and who signs off on it before it goes out the door?
In many financial institutions, sustainability teams put the report together, finance may or may not review it, and there often isn't a formal approval chain that matches financial reporting. That creates a mess: figures can differ across annual reports, investor decks, and regulatory disclosures, with little proof of who reviewed, challenged, or approved the numbers.
Set named roles for each step in the process: Metric Owner, Data Steward, Finance/Risk Reviewer, Compliance Reviewer, and Disclosure Owner. Each role covers a specific task - preparation, review, challenge, or approval - so accountability is clear across the reporting lifecycle.
This lines up with the three lines of defense: the business owns the data, risk and compliance challenge it, and internal audit tests it.[3][4][5]
Once those owners are in place, the next step is a formal approval path.
Use maker-checker and four-eyes controls for material metrics and narrative claims.[7][8] Routine indicators can move through management approval. But material metrics - like Scope 1–3 emissions or financed emissions - should go through finance, risk, compliance, and CFO/controller sign-off.[2][3]
If the methodology changes, that should not stay buried in a working file. Changes like a new emissions factor or a shift in financed-emissions coverage should be escalated to the Board ESG or Audit Committee.
The control design below assigns responsibility and the evidence each role should leave behind.
| Role | Core Responsibility | Required Evidence |
|---|---|---|
| Sustainability Data Steward | Data collection, quality checks, first-level validation | Data quality reports, source reconciliation logs |
| Finance Controller / ESG Controller | Validates ESG metrics against financial accounts and regulatory returns | Review sign-off logs, reconciliation notes |
| Risk / Model Owner | Reviews climate scenario assumptions and risk-related ESG metrics | Challenge notes, model validation records |
| Legal / Compliance Officer | Checks alignment with regulatory expectations and ESG disclosure rules | Review comments, compliance sign-off |
| Disclosure Committee | Final approval of ESG narratives and KPIs before publication | Committee minutes, approval timestamps |
| Board ESG / Audit Committee | Oversight of material ESG risks, methodology changes, and reporting quality | Board minutes, escalation records, agenda materials |
This role design makes weak spots easier to see. For example, you can spot when no one clearly owns a metric - or when the same person is both preparing and approving it. Just as important, it gives internal audit and external assurance providers the records they need to confirm that governance controls are working as designed.[1][2][6]
Approvals alone don't save ESG reporting. It starts falling apart when evidence lives in email, spreadsheets, and shared drives.
That kind of sprawl creates two problems at once. First, it makes reporting hard to defend. Second, it puts sensitive workforce, client, and portfolio data at risk. That can include employee demographic data used for DEI metrics, client-level sustainability scores, and asset-level climate risk indicators. When too many files sit in too many places, the odds of unauthorized access and privacy issues go up fast.
Without a governed evidence model, you can't reliably show how a reported ESG figure was produced, who reviewed it, or whether the method changed from one reporting period to the next. And that's exactly what auditors and regulators want to see. They expect a complete evidence package for each metric, or the disclosure can be challenged.
The answer is simple in principle, even if the setup takes work: use a governed evidence model with controlled access and complete audit trails.
Each ESG metric should have one evidence package stored in a single policy-controlled repository.[10]
That package should include:
Each item should also be tagged with the metric name, reporting period, preparer, approver, and source system. That way, teams aren't left digging through folders and inboxes trying to piece together the story after the fact.
Retention rules should run automatically, not depend on individual users remembering what to keep. For materials that support external disclosures, a 7-year minimum lines up with SEC books-and-records expectations.[9] Methodology documents and policy memos should stay longer than the minimum schedule. Why? Because those files often explain why a number was calculated a certain way, not just what was reported.
Version control matters just as much. Every edit should create a new version inside the repository. And each reporting cycle should have a read-only snapshot that cannot be changed after filing. That's the difference between a clean record and a mess no one can defend later.
Access should follow a least-privilege model. In plain English: people get access only to what their job requires, and nothing extra.
Preparers should be able to create and edit workpapers, but they should not be able to finalize or approve reporting packages. Approvers should be able to review and sign off, while having limited rights to change the underlying data. View-only users, such as internal audit and senior management, should be able to see the evidence without altering it.
Some data needs even tighter limits. Sensitive workforce metrics should be restricted to HR and designated ESG staff. Portfolio-level climate risk data should be limited to risk and portfolio management teams. Not everyone needs the keys to every room.
Every access, edit, approval, and deletion should be logged with a system timestamp and user ID. Change tracking should clearly record manual overrides and exceptions, including reason codes and approver identities. Audit logs also need to be immutable, using write-once storage or cryptographic integrity checks.
If someone changes a number by hand, the system should show who did it, when they did it, and why.
That's not overkill. That's what an audit-ready setup looks like.
The right storage model depends on scale, sensitivity, and audit needs.
| Model / Approach | Auditability | Security | Scalability | Operational Burden |
|---|---|---|---|---|
| Centralized repository | Strong - one location, consistent metadata and controls | High - uniform RBAC and retention policies | Good - new metrics plug into existing governance | Higher upfront effort for migration and standardization; requires all BUs to adopt the system |
| Distributed (BU-level) storage | Weak - inconsistent controls across units | Lower - uneven RBAC and logging | Poor - cross-institution analysis becomes difficult as ESG scope grows | Low short-term if existing tools are reused; teams operate independently, increasing fragmentation risk |
| Hybrid model | Moderate to strong - core evidence centralized, BU artifacts locally managed under policy | Moderate to high - depends on how tightly BU repositories are governed | Best - scales as ESG reporting matures; new regions and metrics integrate into central governance | Moderate - requires clear data ownership, interface standards, and active central monitoring of BU adherence |
| Broad RBAC | Moderate - logs show repository access but lack metric-level granularity | Lower - broad roles may overexpose sensitive workforce or client data | Simple to maintain | Low - fewer roles and permission sets to manage; suitable for smaller or early-stage programs |
| Metric-level RBAC | Strong - logs show which users accessed which specific metrics or datasets | High - access tailored to job function and data sensitivity | Requires mature IAM processes to sustain | Higher - detailed role modeling, testing, and lifecycle management needed; forces clear ownership of data and controls |
Even with these evidence controls in place, ESG reporting can still fail when the data doesn't tie back to finance and risk systems.
After teams get evidence and approvals under control, another problem shows up fast: ESG data and finance data often live on separate tracks. A lot of institutions still process ESG information outside accounting, FP&A, and risk systems.
That split creates obvious trouble. A bank’s sustainability report might say financed emissions are on track, while its annual filing shows more exposure to high-carbon sectors. When ESG data doesn’t line up with finance and risk data, reporting gets messy and management decisions get weaker. If ESG metrics aren’t linked to credit risk, capital planning, or stress testing, leaders can’t tell how ESG performance affects return on equity or cost of capital.
The answer is simple in principle, even if it takes work in practice: ESG data should move through the same reporting setup as finance and risk data.
Each material ESG metric needs a defined tie to a financial account, a planning input, or a risk measure. Without that, reconciliations, approvals, and audits can’t show that the numbers match.
Here’s what that looks like:
Use the same source data, the same cut-off, and the same assumptions across ESG and finance reporting. If one team is working off a different version of the truth, the numbers won’t hold up.
Once those data links are set, they need to be governed through the same close, reconciliation, and change-management processes used in finance.
In practice, that means ESG should not run on its own side process.
These linkages need to be explicit, documented, and tested.
| ESG Metric | Financial / Risk Linkage | Required Controls |
|---|---|---|
| Financed emissions (Scope 3, Cat. 15) | Loan sub-ledger balances by sector; allowance for credit losses; RWA in stress scenarios | Joint ownership (ESG + Credit Risk); reconciliation to GL; documented sector mapping assumptions |
| Operational energy use (Scope 1 & 2) | Occupancy/utility expense (income statement); CapEx for efficiency upgrades (balance sheet) | Reconciliation to utility invoices and fixed-asset register; shared close calendar |
| Workforce metrics (headcount, turnover, DEI) | Compensation and benefits expense; recruiting costs; segment profitability | Reconciliation to payroll register and HR master file; segregation of duties |
| Governance indicators (policy adherence, fines) | Legal and remediation reserves; operational risk loss data in the GL | Linkage to risk event database; documented escalation path for material items |
| Physical climate risk for collateral | Collateral haircuts; loss severity assumptions in credit models | Validated risk model inputs; version-controlled assumption documentation; model risk review |
ESG reporting now faces audit-level scrutiny. That means weak controls can lead to disclosure problems, assurance issues, and reputational damage. The answer isn’t more ESG activity. It’s better control design.
Build four controls: a source registry, named approval owners, one governed evidence repository, and reconciliations to finance and risk.[14][12][10][13][15]
Each one addresses a specific failure point: traceability, approval, evidence, or linkage to finance.
Start with a source registry. This is a documented catalog that links every ESG metric to its source system, owner, collection frequency, and calculation method. It sets the base for every other control.[14]
Next, assign control owners across sustainability, finance, risk, and compliance. Approval hierarchies should match financial sign-off structures: data collectors should be separate from reviewers, reviewers should be separate from approvers, and material disclosures should include executive certification.[12]
Then bring all supporting evidence into one governed repository. That includes invoices, system extracts, and calculation workbooks. The repository should use role-based access and system-generated audit trails.[10][13]
Last, reconcile ESG metrics to financial accounts and risk measures on the same close schedule used for financial reporting. Use recurring reconciliations and control testing so this work becomes part of the normal reporting rhythm, not a last-minute scramble.[15]
Institutions that treat these steps like a one-time project often struggle when standards change or assurance scope grows. Teams that build ESG controls into recurring close, reconciliation, and testing cycles are in a much better position to produce reporting that stands up to assurance.[12]
A well-designed ESG control framework produces reporting that management can trust, auditors can test, and regulators can review.
Use a formal materiality assessment that scores each topic on two dimensions: financial magnitude and impact severity.
Start with 20 to 40 topics drawn from SASB, ISSB, and GRI. Then apply a clear cutoff, such as 3 out of 5, to narrow the list to 8 to 15 material topics.
Just as important, document the scoring rationale for each topic. That helps reduce bias and gives you a defensible audit trail if anyone later asks, “Why did this issue make the list while that one didn’t?”
Pull data straight from the operational systems where ESG information starts. That helps with accuracy, completeness, and traceability.
In most companies, that means data coming from ERP systems, HRIS platforms, CRM tools, MES, SCADA, process data historians, legal contract management systems, and external feeds from banks, utility portals, and third-party providers.
Reconcile ESG data to finance and risk data during the monthly close. Run the ESG review right after the general ledger and trial balance review, so the team is working from a closed financial period.
Also review month-over-month changes in ESG metrics alongside financial variance analysis. For utility data, reconcile each month against bills or meter readings before the final data lock.