Published on
January 2, 2026

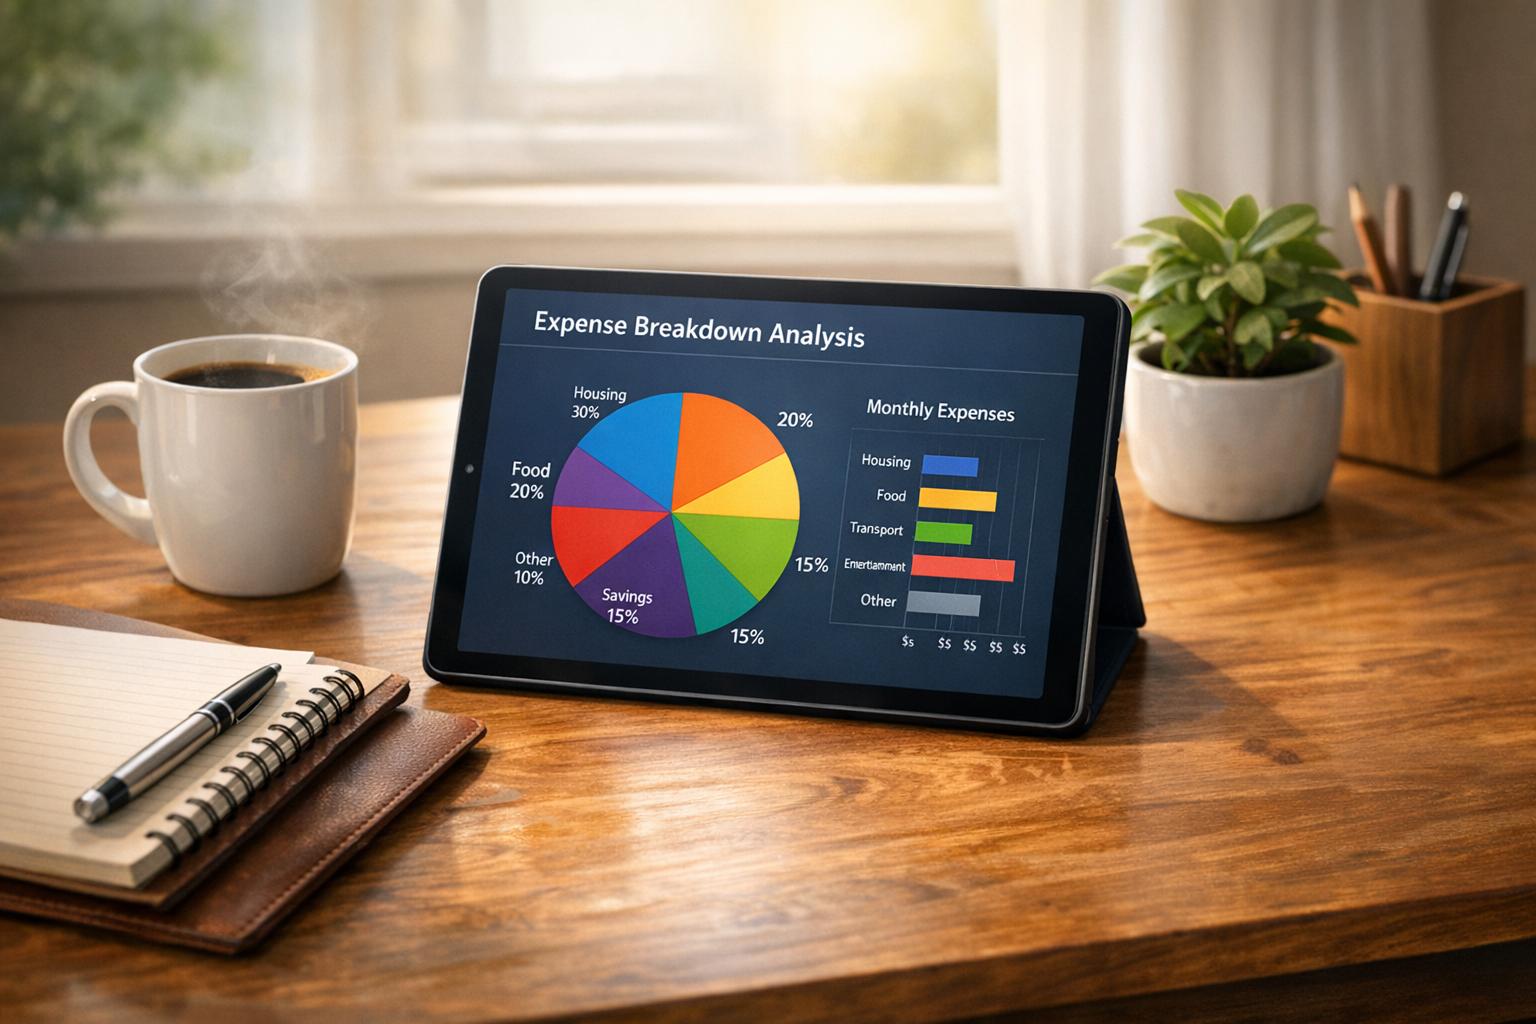
Understanding where your money goes is the first step to better financial health. With a tool like our spending distribution analyzer, you can easily map out your costs across different categories and see the big picture. Whether you're juggling rent, groceries, or subscriptions, having a clear view of your outflows empowers you to make informed decisions.
Numbers on a spreadsheet can be hard to digest. That’s where a budget breakdown tool shines—it turns raw data into visuals like pie charts or bar graphs. Imagine spotting at a glance that 40% of your income goes to housing. That kind of insight can spark changes, like cutting back on non-essentials or renegotiating bills. Plus, it’s not just for monthly budgets; use it for one-off projects or seasonal expenses to stay on top of every dollar.
You don’t need to be a finance expert to get started. Just input your expense categories and amounts, and let the tool do the math. It’s free, fast, and designed to help anyone—from students to small business owners—gain clarity on their cash flow. Try it today and take the guesswork out of budgeting!
Absolutely! Whether you’re tracking personal spending like bills and entertainment or business costs like supplies and travel, this tool works for any type of expense. Just label your categories clearly, input the amounts, and you’ll get a detailed breakdown either way. It’s flexible enough to adapt to your needs.
No worries—we’ve got you covered. If you enter a negative number, leave a field blank, or type something that’s not a number, the tool will prompt you to fix it. It’ll ask for valid, positive numbers in all fields before showing results, so your breakdown is always accurate.
Not really! As long as the numbers are positive, you can input any amount—whether it’s $5 for coffee or $5,000 for rent. The tool calculates the total and percentages no matter the size of your expenses. Just keep in mind that very large numbers might affect how the chart looks visually.