Published on
April 17, 2026

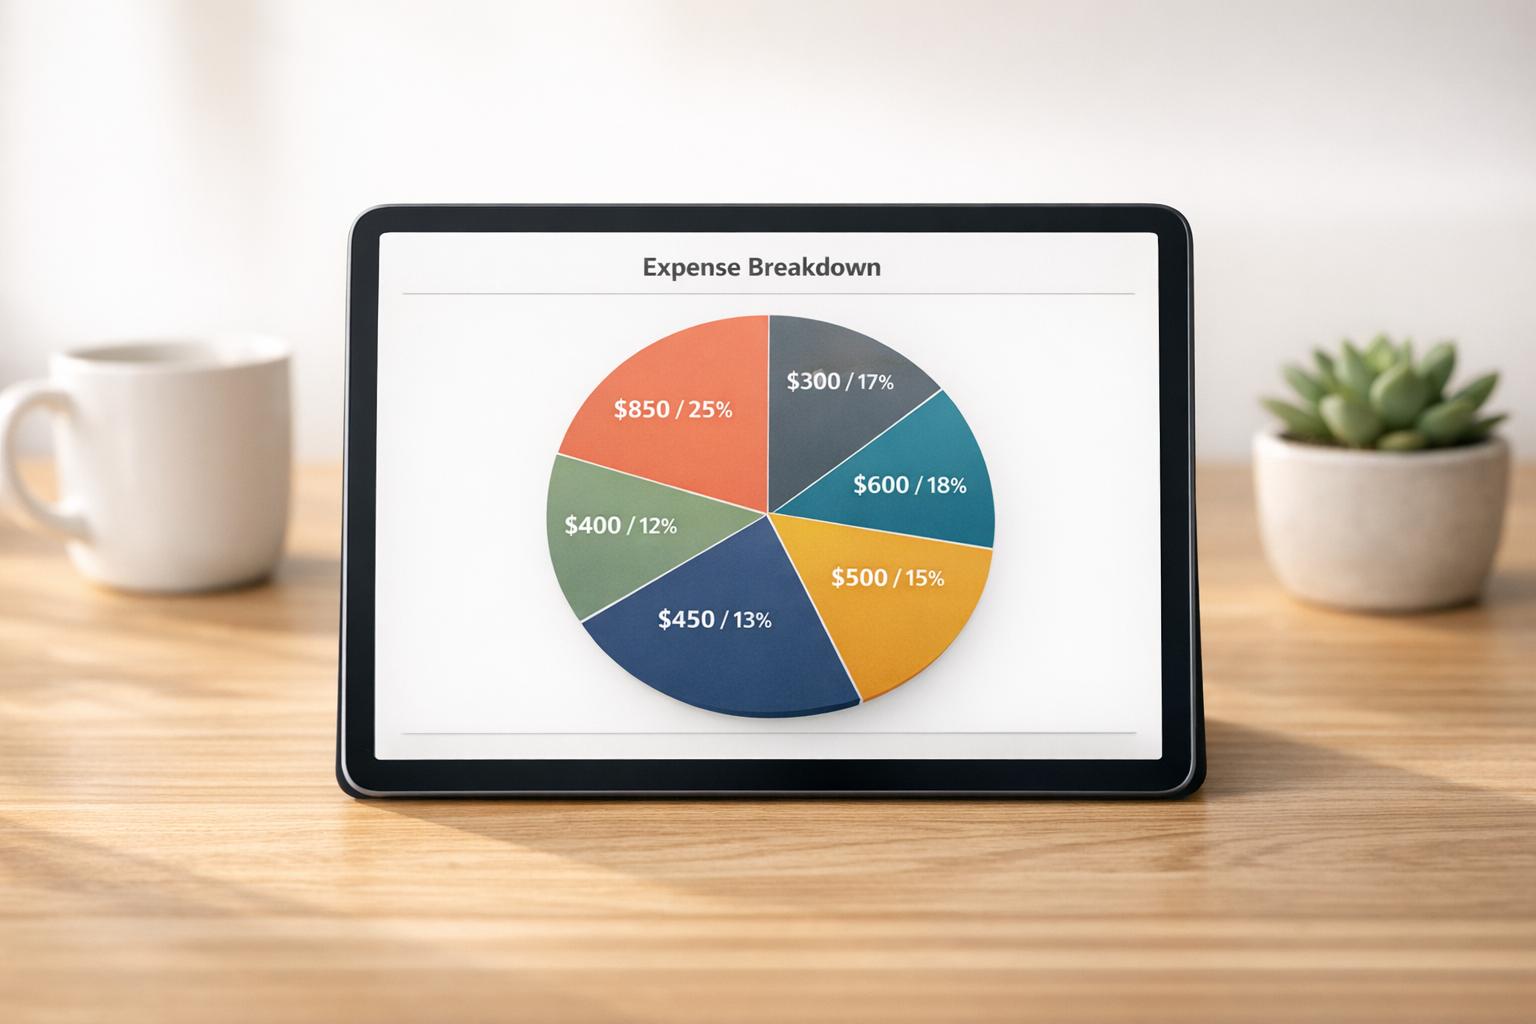
Managing money can feel overwhelming, especially when you’re not sure where it’s all going. That’s where a tool to visualize your expenses comes in handy. By breaking down your total spending into clear categories like rent, utilities, or entertainment, you gain insight into your financial habits without the guesswork. It’s a game-changer for anyone trying to save more or just stay on top of their budget.
Seeing your expenses laid out in a chart or list can reveal patterns you might’ve missed. Maybe you’re spending more on subscriptions than you thought, or your grocery bill has crept up over time. A simple expense breakdown tool transforms raw numbers into something tangible, making it easier to set goals or cut back where needed. Plus, with built-in error checks for things like incorrect totals or invalid inputs, you can trust the results.
Whether you’re a budgeting newbie or a seasoned saver, getting a handle on your spending is the foundation of financial health. Try categorizing your expenses today and see the difference a clear visual can make in how you manage your money.
No worries! If your percentages exceed 100%, the tool will flag the error and ask you to adjust the numbers. It’s designed to catch mistakes like this so your breakdown is always accurate. Just tweak the values until they add up correctly, and you’re good to go.
Absolutely, you can input either dollar amounts or percentages for each category. If you use dollars, the tool checks if they match your total expense amount and alerts you if there’s a mismatch. If you go with percentages, it converts them to dollars based on your total. It’s super flexible!
We’ve got you covered. The tool automatically detects negative values and prompts you to correct them before generating the breakdown. This ensures your data makes sense and the visual output—whether it’s a pie chart or list—is something you can actually use to plan your budget.