Published on
August 27, 2026


Fund size changes how venture returns look - fast. In plain terms: smaller VC funds often show higher IRR and hit high TVPI more often, while larger funds more often show a bigger gap between paper value and cash returned.
If I were sizing up a venture fund, I’d start with three points:
And fund size changes all three:
The numbers in the article make that clear:
So if I compare funds, I would not look at one metric alone. I would compare by:
That’s the short answer: smaller funds often look better on IRR and TVPI, while larger funds more often struggle to turn marks into DPI.
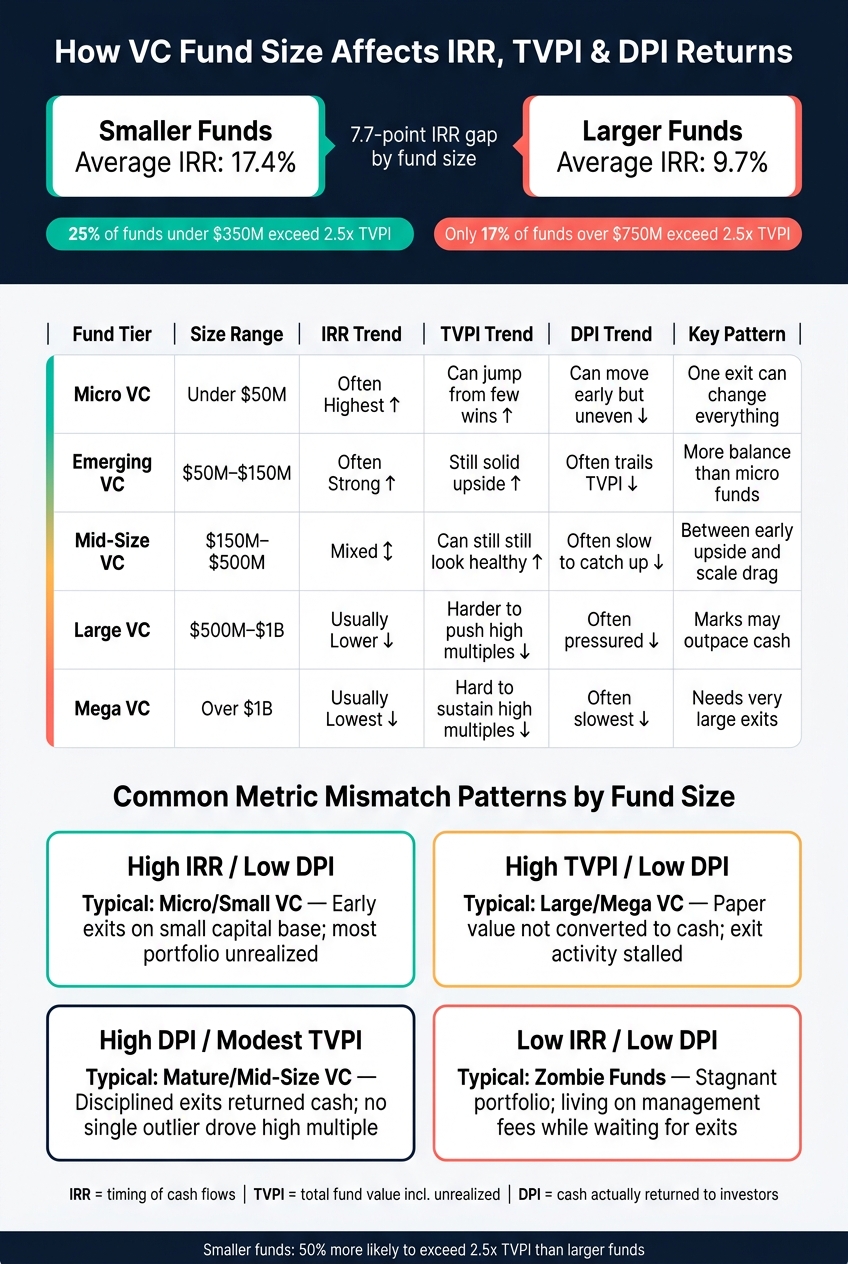
VC Fund Size vs. IRR, TVPI & DPI: Key Performance Differences
| Fund size | IRR trend | TVPI trend | DPI trend | Main pattern |
|---|---|---|---|---|
| Micro | Often highest | Can jump from a few wins | Can move early, but uneven | One exit can change everything |
| Emerging | Often strong | Still solid upside | Often trails TVPI | More balance than micro funds |
| Mid-size | Mixed | Can still look healthy | Often slow to catch up | Between early upside and scale drag |
| Large | Usually lower | Harder to push high multiples | Often pressured | Marks may outpace cash |
| Mega | Usually lowest among these tiers | Hard to sustain high multiples | Often slowest | Needs very large exits |
If you want the clean read, it’s this: timing drives IRR, marks drive TVPI, and exits drive DPI - but fund size shapes how far apart those numbers can get.
Micro funds tend to swing more than larger funds. One early exit can move IRR, TVPI, and DPI in a big way. There just isn’t much margin for error, so a single deal can shape the fund’s reported results.
In smaller funds, IRR is heavily tied to timing. If the first markup or exit happens early, IRR can jump fast. If liquidity takes longer, that lift starts to wear off.
That timing edge helps explain why smaller venture funds have posted a 17.4% average cumulative IRR, compared with 9.7% for larger funds[1][2].
Micro funds often invest earlier, when entry valuations are lower. That can leave more upside if one company takes off. Add a concentrated portfolio, and the effect gets stronger.
A small fund may need only one or two breakout companies to push TVPI above 2.0x. A larger fund usually needs those wins spread across a much bigger set of investments.
This is where TVPI can get ahead of DPI. Paper gains don’t turn into cash on their own. That shift depends on follow-on funding and exit markets.
Right now, late-stage and growth investors are struggling to deploy capital because of valuation gaps. That has made it tougher for early-stage funds to turn TVPI into DPI. In plain English: a portfolio company may look stronger on paper, but if later investors slow down or price rounds lower, those gains may stall before cash comes back to LPs.
That gap between paper value and cash is baked into how many smaller funds work. Early-stage marks are often set by follow-on rounds led by larger investors. When those investors pull back, strong TVPI can take a while to show up in DPI.
As fund size goes up, these swings usually become less sharp. But the tension between paper value and cash doesn’t just disappear.
Emerging funds are in a useful middle ground. They’re still small enough to keep much of the upside from early-stage investing, but big enough to spread risk across more companies.
That matters. With micro funds, one big winner can make the whole fund. Emerging funds don’t lean as hard on a single breakout exit. They still have strong upside, but portfolio breadth gives them a bit more cushion.
IRR still swings with timing. A delayed exit can change the picture fast, even when the underlying companies look strong.
That said, emerging funds usually hold up better on IRR than large funds. They still beat bigger funds on this metric, though the edge isn’t as sharp as it is with micro funds.
Smaller funds are about 50% more likely to return more than 2.5x TVPI than large funds. In the data, 25% of funds under $350 million hit that level, compared with 17% of funds over $750 million [1][2].
Part of the reason is simple: emerging funds can get into companies before late-stage prices move higher. That gives them more room for multiple expansion. So the upside can still be there, even if cash returns haven’t shown up yet. In many cases, DPI is the metric that trails behind.
DPI often lags TVPI because these are still early-stage vehicles. Exits don’t happen on a neat schedule, and timing can vary a lot from one company to the next.
There’s another issue too. Valuation gaps can slow the move from mark to cash when later-stage investors price rounds more cautiously or pull back [1][2]. So a fund may show paper gains well before those gains turn into distributed capital.
When you look at TVPI, it helps to pressure-test the marks. Are they tied to a real path to exit, or do they mostly reflect the last financing round?
Mid-size funds sit in an awkward middle ground. They still offer some of the upside you get from early-stage investing, but they also start to take on the scale issues that come with bigger funds. At the lower end of this range, funds can still write smaller checks and get into deals with more room for upside. As a fund gets closer to $500 million, though, that scale can slow deployment and push exits farther out.
IRR tends to hold up better at the lower end of this range, then starts to compress as deployment takes longer. Smaller mid-size funds can still keep a lot of that timing edge. But as fund size moves up, that advantage starts to fade.
TVPI is still strongest when a fund can invest earlier and get to exits without leaning on a small number of huge outcomes. Mid-size funds can still get into smaller, more reasonably priced deals, and that helps keep upside in play. That’s why TVPI can still look healthy in this tier even when DPI hasn’t caught up.
Mid-size funds are still carrying marks tied to 2020–2021 valuations, but many portfolio companies haven’t reset to those levels. That mismatch between last-round marks and actual exit prices has slowed the move from paper gains to cash distributions. So you can end up with a fund that looks good on TVPI while DPI barely moves.
The next size tier shows what happens when that timing gap gets even wider.
At this size, scale starts to work against returns. Large funds need to put more money to work, and that makes IRR, TVPI, and DPI tougher to keep strong.
IRR gets weaker as holding periods stretch out. Large funds average 9.7% IRR versus 17.4% for smaller funds [1][2], and these funds often put more weight on late-stage deals that take longer to exit.
And this isn't just about annualized return. The same pressure shows up in multiple expansion too.
Strong TVPI is harder to hit at this size. Only 17% of venture funds larger than $750 million have returned more than 2.5x TVPI, compared with 25% of funds under $350 million [1][2]. Put simply, large funds are about one-third less likely to clear that mark.
That helps explain why scale makes repeat top-tier multiple performance harder to keep up.
But strong marks don't always mean cash is coming back.
DPI is often where large funds feel the most pressure. Many large funds raised in 2020 and 2021 carry marks that are harder to turn into cash, and late-stage liquidity has slowed. Without exits, distributions lag.
This gap gets biggest when unrealized gains still haven't turned into exits. A fund can look solid on paper and still have trouble sending cash back to LPs. At this size, TVPI can stay propped up by marks while DPI trails, simply because those marks haven't become cash yet.
That spread between paper value and cash is the clearest sign that one metric can look strong while another falls behind. Fund size can push one number up even as another stalls.
Large funds already have a hard time turning marked-up valuations into actual cash. Mega funds feel that strain even more. The math is simple: when the fund is this big, every return target depends on much larger exits.
At this size, slower exits put pressure on IRR. Large funds average 9.7% IRR versus 17.4% for smaller funds, which leaves a 7.7-point gap.[1][2]
Mega funds tend to lean into late-stage and growth deals. Those companies often take longer to exit, so IRR gets squeezed even when the portfolio still looks good on paper.
Strong TVPI is less common at this scale. Only 17% of funds above $750 million have topped 2.5x TVPI, compared with 25% of funds below $350 million.[1][2]
Why does that happen? Bigger funds have a tougher time getting into companies before late-stage pricing climbs. That leaves less room for multiple expansion later on.
This is where the split between TVPI and DPI can hang around for years. Many mega funds still hold unrealized gains from peak years like 2020–2021 that still haven't turned into cash through exits.[1][2]
So the portfolio may look strong in marked value, but distributions lag. At this size, paper gains often move ahead of cash because exits take longer and valuation gaps are still wide. Some mega funds even drift into "zombie fund" territory, staying alive on fees while they wait for exits.
That spread between strong marks and weak distributions sets up the small-versus-large trade-offs in the next section.
The size-tier patterns above lead to metric gaps that show up again and again. IRR, TVPI, and DPI don't measure the same thing. One leans on timing, one reflects paper value, and one shows cash already returned. So when they don't line up, that usually comes down to exit timing and how much of the portfolio is still unrealized.
Smaller funds often show stronger IRR because they return cash earlier relative to the amount of capital in the fund. That earlier cash flow can make the annualized return look better.
Larger funds usually carry more late-stage positions, and those deals can take longer to exit. As time drags on, IRR tends to get squeezed even if the fund still holds assets with solid paper value.
Smaller funds are also more likely to show high TVPI. A small number of early winners can move the multiple fast, especially when the fund size is smaller.
With larger funds, that paper value often takes more time to turn into actual distributions. So a strong TVPI number doesn't always mean cash is about to hit investors' accounts.
DPI stays behind until exits are done and cash is paid out. It's usually the first metric to lag, even when IRR and TVPI still look healthy.
The gap between TVPI and DPI is unrealized portfolio value. When exits slow down, that value stays on the books - sometimes for years - while distributions barely move.
These gaps tend to show up in a few familiar patterns:
| Scenario | Typical Fund Size | What It Reveals |
|---|---|---|
| High IRR / Low DPI | Micro / Small VC | Early exits on a smaller capital base; most of the portfolio remains unrealized |
| High TVPI / Low DPI | Large / Mega VC | Paper value has not converted to cash; exit activity is stalled |
| High DPI / Modest TVPI | Mature / Mid-Size VC | Disciplined exits returned cash, but no single outlier drove a high total multiple |
| Low IRR / Low DPI | Zombie Funds | Stagnant portfolio; fund is living on management fees while waiting for exits |
Across fund sizes, the trade-off is pretty straightforward: smaller funds often post stronger upside metrics, while larger funds usually look steadier.
Smaller funds often show higher early IRR and TVPI because one exit can change the picture fast. If a fund owns a meaningful stake in a company that breaks out, results can jump in a hurry.
But there’s a flip side. That same concentration can hurt just as fast if exits don’t happen. A tight portfolio with one big winner can look great on paper, yet a tight portfolio without that winner can fall behind just as quickly. More dispersion in outcomes cuts both ways.
Larger funds hold more positions, so results tend to move with less drama. Interim marks are often steadier because no single company carries too much of the portfolio. That leads to stability, but not necessarily better multiples.
Scale is the main limit here. As fund size goes up, top-tier returns get harder to produce on a repeat basis. A $1 billion fund needs to return $2 billion to reach 2x TVPI. That means finding exits at a scale that is much harder to pull off again and again. That’s also why DPI conversion often lags and multiples tend to compress as fund size grows.
| Fund Tier | IRR Advantages | TVPI Advantages | DPI Advantages | Key Drawbacks |
|---|---|---|---|---|
| Smaller Funds | Higher average IRR; faster movement on early exits | About 50% more likely to exceed 2.5x TVPI [1][2] | Faster potential DPI from early-stage exits | More outcome dispersion; portfolio concentration risk |
| Larger Funds | More stable interim marks due to diversification | Established brand and scale support portfolio stability | Larger absolute cash distributions upon exit | Lower average IRR [1][2]; slower multiple expansion; DPI conversion pressure |
The last step is turning reported value into cash. Clean books and exit-ready reporting help move TVPI into DPI. And that gap is where fund size has the clearest effect on what investors actually get back.
Across the fund-size tiers above, the pattern stays the same: timing drives IRR, marks drive TVPI, and exits drive DPI. Those three metrics do not rise and fall together, and fund size helps explain why. Smaller funds often post stronger IRR. Larger funds, on the other hand, can show more paper value than cash paid back to investors. The smart move is to read all three side by side.
The numbers make that gap plain. Smaller venture funds average 17.4% IRR versus 9.7% for larger funds, and 25% of smaller funds exceed 2.5x TVPI versus 17% of funds above $750 million [1][2]. A smaller fund may turn a handful of exits into strong IRR and DPI. A larger fund usually needs many more exits before paper gains show up as cash in hand.
That’s why fund comparisons need to account for size, vintage, and strategy at the same time.
One of the biggest mistakes in venture fund analysis is lining up funds that were never a fair match in the first place. A micro VC fund and a mega fund from the same vintage may sit in the same market, but they play a very different game. Their portfolio construction differs, their exit timelines differ, and the math needed to return capital differs too.
A fair comparison starts with the basics:
That helps separate manager skill from market cycles and the limits that come with fund size. Benchmarks only help when the peer set lines up with the fund’s size and vintage. IRR and TVPI mean little on their own. They only tell the right story when you read them in context.
A fund can post high TVPI and low DPI at the same time because those metrics look at different parts of the picture.
TVPI includes both cash already paid out to investors and the estimated value of investments the fund still holds.
DPI, on the other hand, counts only cash that has actually been returned. So a fund might be sitting on investments that look very valuable on paper, which pushes up TVPI, while DPI stays low because those investments haven’t been sold yet.
No. A higher IRR does not automatically mean a venture capital fund is better.
IRR is very sensitive to the timing of cash flows, so it can make faster, smaller returns look better than they are. It also does not account for the total dollars returned.
To judge fund performance, look at IRR alongside:
Compare funds across size tiers in context, not by raw performance alone. A small, newer fund and a large, mature fund can look very different on paper, even when the story underneath is fairly similar.
Use time-series analysis to evaluate funds at similar lifecycle stages, since DPI is naturally low in the early years. That matters. If you compare a young fund to one that’s already had time to return cash, you’re not looking at a fair matchup.
For a fuller view, look at IRR for time-adjusted efficiency, TVPI for total potential, and DPI for actual liquidity. Then benchmark those figures against funds with similar strategies, vintage years, and geographic focus. That way, you’re comparing like with like instead of mixing very different fund profiles.