Published on
July 21, 2026


If you sell SaaS in more than one region, one global USD price can hurt both growth and margin. I’d fix that by tracking ARR, realized price, COGS, and gross margin by region, then setting 3 to 5 regional price tiers, FX rules, and discount limits.
Here’s the short version:
A few numbers stand out. Many teams start regional margin tracking when they hit $1,000,000 ARR in one non-USD market or $2,000,000+ across non-USD markets. In many cases, Western Europe lands near 90% to 110% of U.S. willingness to pay, while markets like India or Brazil may need prices 20% to 50% lower.
My takeaway: geographic pricing works best when I keep four things lined up: market baseline, local willingness to pay, FX rules, and discount control. If one slips, margin slips too.
| Area | What I’d do |
|---|---|
| Pricing model | Start with regional tiers |
| Market setup | Group customers into a few regions |
| FX rule | Use a 30- to 90-day average rate plus a 2% to 5% buffer |
| Price reviews | Quarterly or twice a year |
| Discount control | Set regional floors and approval bands |
| Rollout | Pilot in 2 to 4 markets for 90 days |
Below, I’d turn that into a simple plan you can use without making your pricing system hard to run.
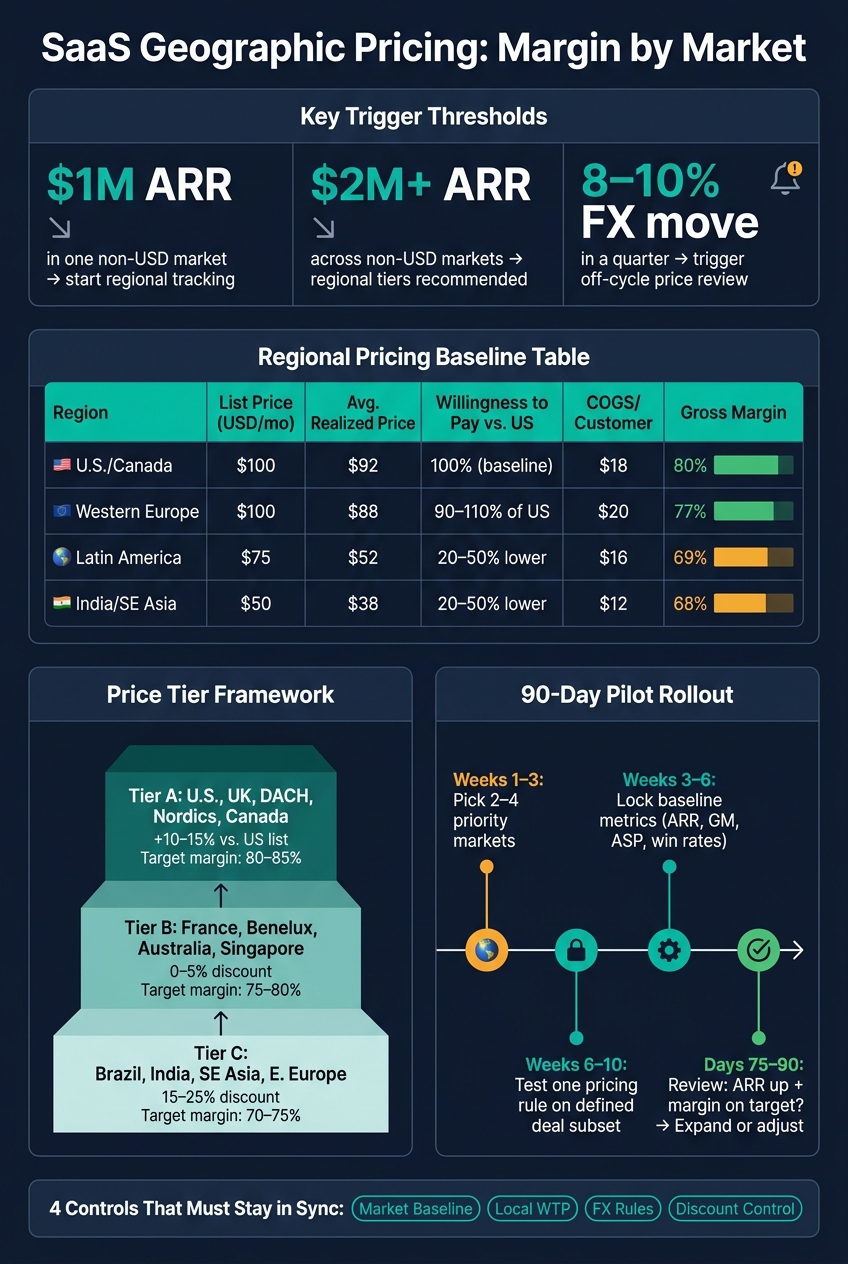
SaaS Geographic Pricing Tiers: Margin by Region
Before you change prices, get a clear market-by-market view of price, cost, and margin. In plain English: know what you charge, what it costs you to serve each market, and what margin is left. Then use that view to make pricing calls with less guesswork.
Start by grouping customers into practical regional buckets. Common starting points include U.S./Canada, Western Europe, Latin America, and India/Southeast Asia. Pick groups that line up with your sales motion, currency, and support footprint. These clusters usually share similar purchasing power, local competition, and go-to-market patterns.
Once the segments are set, estimate what buyers in each region will actually pay. Use four inputs:
Use PPP as a starting anchor, not the final answer. Then pressure-test it against win/loss data and local market pricing.
Western Europe is close to U.S. levels - about 90% to 110% of U.S. willingness to pay after VAT adjustments. Meanwhile, markets like India or Brazil often need prices that are 20% to 50% lower for the same product.[2] That gap has a direct effect on tier design and on the discount guardrails you set later.
With your segments in place, calculate the unit economics for each one. Pull 12 to 24 months of billing data and convert all amounts to USD using one FX rule only: booking-date spot or monthly average. Don’t mix methods. Then compare realized price with list price. That gap tells you how much of your listed price you’re actually keeping after discounts and deal adjustments.
Allocate COGS by region using observable drivers, not made-up percentages. Infrastructure costs can be split by data transfer or compute usage. Support costs can be tied to ticket volume or hours. Payment processing fees are often tagged by transaction geography already. Here’s what a clean baseline can look like for a core SaaS SKU:
| Region | List Price (USD/mo per seat) | Avg. Realized Price (USD) | Local currency per $1 | COGS per Customer (USD/mo) | Gross Margin |
|---|---|---|---|---|---|
| U.S./Canada | $100.00 | $92.00 | 1.00 | $18.00 | 80% |
| Western Europe | $100.00 | $88.00 | 0.95 | $20.00 | 77% |
| Latin America | $75.00 | $52.00 | 5.00 | $16.00 | 69% |
| India/Southeast Asia | $50.00 | $38.00 | 80.00 | $12.00 | 68% |
The main point here isn’t the list price by itself. It’s the relationship between realized price and margin in each region. That’s where you spot the leaks: prices that are too low, discounts that cut too deep, or service costs that eat into margin.
Connect your CRM, billing, and GL data so ARR, COGS, and gross margin update by region in one monthly model. That gives you a steady view you can use to reset prices and discount guardrails market by market.
Once this baseline runs on a repeat schedule, you can set local prices with more control - and keep FX shifts or discount drift from quietly chipping away at margin.
Once you’ve set your regional margin baseline, the next job is turning your U.S. list price into local prices that still protect margin as exchange rates move.
Pick your currency strategy based on how much of your revenue comes from outside the U.S.:
USD-only pricing keeps billing simple. Multi-currency display cuts down on sticker shock. FX-indexed local pricing gives buyers the smoothest experience, but it also asks more from your systems.
| Currency Strategy | Best Fit | Margin Stability | Buyer Trust | Operational Complexity |
|---|---|---|---|---|
| USD-only pricing | <30% non-U.S. revenue, SMB/self-serve | High | Lower in non-USD markets | Low |
| Multi-currency display | Scaling internationally, mid-market | Moderate | Improved | Low to moderate |
| FX-indexed local pricing | Enterprise, high ACV, >30% non-U.S. ARR | Moderate (with rules) | Highest | High |
No matter which path you pick, set your FX adjustment rule before launch. A simple approach is to use a trailing 30- to 90-day average exchange rate instead of the daily spot rate. Then add a 2% to 5% buffer when you convert your U.S. base price into local list prices.
Here’s what that looks like in practice: if the 90-day average USD–EUR rate is 0.90 and you apply a 3% buffer, your operating rate becomes 0.873. That turns a $100/month plan into €90/month instead of €87/month. That small buffer helps absorb minor FX swings before your next scheduled price review.
It also helps to set a trigger for off-cycle reviews. A common threshold is an 8% to 10% move in any major currency within a quarter. If that happens, review pricing then instead of waiting for the next scheduled update.
Update local list prices quarterly or twice a year, in line with your catalog release cycle. That keeps you away from two bad outcomes: constant small changes that confuse buyers, and stale prices that slowly eat into margin as FX drifts.
Once the currency rule is in place, use local willingness to pay to shape your tiers.
Start with the FX-adjusted base price from the last step. Then build tiers from there.
Use Tier A for high-purchasing-power markets, Tier B for middle markets, and Tier C for price-sensitive markets.
Each tier should map to a target gross margin band, not just a cheaper or more expensive price. It should also reflect local costs like payment processing fees, regional support, and sales commissions.
| Tier | Example Markets | Price vs. U.S. List | Target Gross Margin | Typical Contract Terms | Conversion Impact |
|---|---|---|---|---|---|
| Tier A | U.S., UK, DACH, Nordics, Canada | +10–15% | 80–85% | Annual prepaid, auto-renewal | Neutral to positive |
| Tier B | France, Benelux, Australia, Singapore | 0–5% discount | 75–80% | Annual or quarterly billing | Neutral |
| Tier C | Brazil, India, Southeast Asia, Eastern Europe | 15–25% discount | 70–75% | Monthly or quarterly, limited bundled services | Meaningfully higher |
This tier table does more than set prices. It sets guardrails too. If a Tier C deal needs a deeper discount, cut scope or support before cutting list price. In other words, change the package before you chip away at price. That’s usually the cleaner way to make Tier C economics work.
Review tier assignments once a year using ASP, win/loss data, and discount patterns. That way, regional price changes stay tied to margin performance, not just old market labels.
After list prices are set, the next control is discount discipline.
Once local prices are in place, discount discipline decides whether margin stays intact. Regional pricing helps protect margin, but only if discounts stay within clear guardrails. The aim is simple: give regional teams some room to work without turning discounting into a quiet margin leak.
Use a discount matrix based on market conditions, not one-off negotiation. Set green, yellow, and red zones for each market, tie discount approval limits to those zones, and connect price floors to two or three market drivers in the margin model, such as FX moves, local competition, and regional support costs.
In green zones, standard discounts apply. In yellow zones, discounts get smaller. In red zones, keep list price in place and cut scope, terms, or service levels instead.
That structure gives teams a clear playbook. It also helps stop the familiar slide from “just this one deal” to margin erosion across a whole region.
Before you lower a regional price or approve a non-standard discount, model the effect on ARR and gross margin under both high- and low-case scenarios. Then ask a blunt question: How much ARR lift is enough to justify the margin hit?
Indicator-anchored frameworks make those calls easier to defend. They give pricing teams a grounded reason for each move and help protect against external shocks that can throw regional plans off course.
Here’s how the three discount models compare:
| Model Type | Margin Predictability | ARR Growth Potential | Control |
|---|---|---|---|
| Ad Hoc Discounts | Low; driven by reactive concessions | High in the short term; risky long term | Minimal; high exception frequency |
| Flat Regional Discounts | Moderate; easier to forecast | Stable; lacks competitive agility | Moderate; set by internal targets |
| Indicator-Anchored Framework | High; linked to external cost and demand drivers | Optimized; allows aggressive plays in stable zones | High; defensible rationale and clear triggers |
After each major market or FX shift, refresh your forecast ranges. And before rolling out new rules across the board, test them in one product line or one region first. It’s a lot easier to fix a pricing rule in a pilot than after it spreads across the business.
Use that same market-level view to see whether the discount rules are doing their job. At a minimum, track:
Review those metrics quarterly. If exceptions start piling up, tighten the guardrails. If margin variance gets wider, move the floor up.
A single USD price list makes sense when international ARR is still small. Once non-U.S. revenue starts to matter - and regional willingness to pay starts to split in a clear way - regional tiers usually make more sense. Start with 3 to 5 tiers so the system stays simple enough to run well.[1][5]
At a basic level, geo-pricing works best when four controls stay in sync: baseline, WTP, FX, and discounts.
If discounting gets loose and FX buffers aren't built in, realized margin can slip below plan. The aim is simple: grow ARR without letting margin drift. Teams that build margin-by-market reporting into their normal FP&A rhythm - checked monthly, with a quarterly pricing review - usually spot drift early, before it snowballs.[4][3] The next move is a narrow rollout that tests those assumptions in live deals.
Use a controlled 90-day pilot instead of a full-market reset. That gives you a clean way to test the model without turning the whole pricing system upside down. Use the baseline from Step 1 as the control group for the pilot.
This lines up with a standard quarterly planning cycle, which makes it easier for finance and go-to-market leaders to work from the same timetable and make calls at the same points in the quarter.
Move to regional pricing when a market shows strong user engagement but weaker conversion rates. That usually points to one thing: pricing is getting in the way.
Start by reviewing your top 10–20 markets. Compare metrics like download-to-purchase or signup-to-paid ratios to see where people are interested but not buying.
It can also make sense to localize pricing when similar local offerings cost less, or when local purchasing power and willingness to pay are different enough to affect revenue.
Use a fixed FX budget rate with a one-standard-deviation cushion to convert local revenue and costs into U.S. dollars. That helps separate operating performance from currency noise and gives you a steadier view of margins.
Add an FX bridge to isolate currency effects. Review pricing quarterly - or monthly in high-volatility markets - and use forwards or options to reduce rate risk.
Prioritize market-based localization instead of flat global discounting. Use Purchasing Power Parity (PPP) to adjust prices to local income levels, so offers stay affordable without giving up too much revenue.
Also look at regional variable costs, like support and infrastructure. Then match pricing to the local LTV:CAC ratio. Before a full rollout, test price sensitivity by segment to make sure higher volume makes up for lower revenue per user.