Published on
August 24, 2026


Green debt is still available in 2026, but it is going to fewer borrowers and with tighter terms. I’d sum up the market like this: utility-scale and C&I projects still get lender interest, residential solar is still under pressure, and pricing now depends more on cash flow, PPA strength, tenor fit, and tax-credit proof than on the green label alone.
If I were a U.S. renewable founder planning debt this year, I’d focus on seven things:
The market numbers tell the story. Issuance was about $1.1 trillion in 2024, then fell to about $904 billion in 2025. In 2026, expectations are mostly flat to slightly up. At the deal level, bridge loans are often pricing around 9% to 12%, while some non-construction bridge debt is landing near SOFR + 300 to 350 bps.
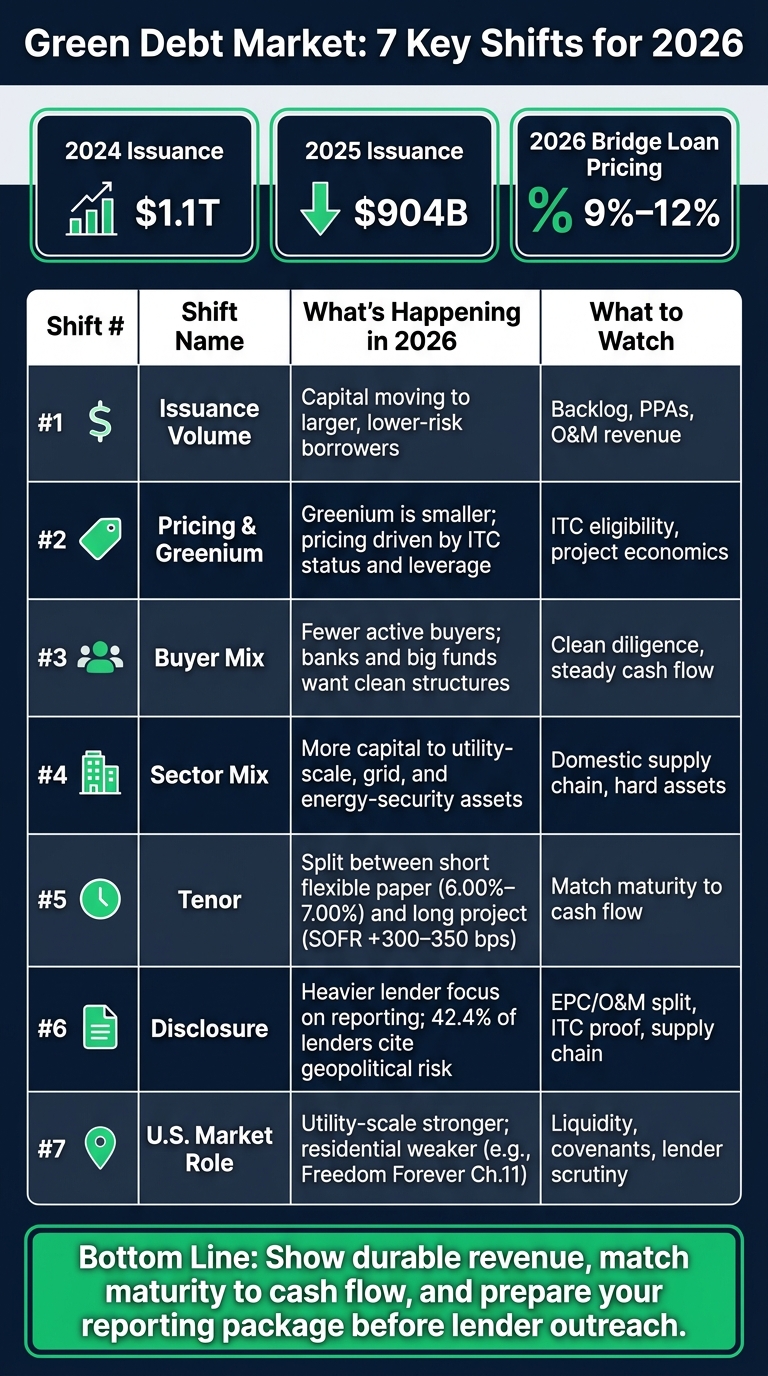
Green Debt Market: 7 Key Shifts for 2026
| Shift | What’s happening in 2026 | What I’d watch |
|---|---|---|
| Issuance volume | Capital is moving to bigger, lower-risk borrowers | Backlog, PPAs, O&M revenue |
| Pricing | Greenium is smaller | ITC status, leverage, project economics |
| Buyer mix | Fewer active buyers in weaker segments | Clean diligence, steady cash flow |
| Sector mix | More interest in utility-scale, grid, and energy-security assets | Domestic supply chain, hard assets |
| Tenor | Split between short flexible paper and long project debt | Match maturity to cash flow |
| Disclosure | More lender focus on reporting quality | EPC/O&M split, ITC proof, supply-chain detail |
| U.S. market role | Utility-scale stronger; residential weaker | Liquidity, covenants, lender scrutiny |
Bottom line: if you want debt in 2026, I’d keep the story simple - show durable revenue, line up the maturity with project cash flow, and get the reporting package ready before lender outreach.
In 2026, green debt is flowing toward larger, lower-risk borrowers. Utility-scale and commercial and industrial (C&I) project finance are taking an outsized share of the money available, while residential solar is still sorting through bankruptcies and lender-led asset sales. That split matters because it shapes who gets funded, and at what price.
A clear example: Zelestra secured a $600 million green financing credit facility from Societe Generale and HSBC to fund the Echols Grove and Cedar Range solar projects in Texas. Together, those projects total 439 MW and are backed by long-term PPAs with Meta [1]. On the other end of the market, Pine Gate Renewables' assets were pulled into a $1.4 billion to $1.5 billion credit-bid sale order from secured lenders that included Brookfield Asset Management and Carlyle Group [2].
As issuance gets more selective, pricing leans harder on two things: balance-sheet discipline and the quality of a company's project pipeline. A big part of that is whether the assets qualify for tax credits [2].
In 2026, bridge loans usually price at 9% to 12%, while non-construction bridge loans are landing around SOFR + 300 to 350 basis points [4]. Strong borrowers can still come in below 10%. Higher-risk plans, though, can push up to 13% [4].
That tighter allocation means investor demand is narrowing around platforms that already have scale and a track record. In plain terms, money is going to groups with:
Bridge lending is still active for transitional deals, but it isn't a stand-in for permanent financing [2].
Deal structures in 2026 are getting more layered. It's now common to see transactions mix construction debt, term loans, tax equity, and ITC sales to third-party buyers [5]. That sounds workable on paper, but in practice it means more moving parts, more lawyers on calls, and more reporting after the deal closes.
Doral Renewables shows what that looks like. In February 2026, it completed final funding for its 48 MW Great Bend Solar project in Ohio using:
That kind of capital stack carries a much heavier documentation and coordination load than a plain bond deal.
Founders should focus on building recurring operations and maintenance revenue, locking in long-term contracts, and getting financing materials ready early. The message from the market is pretty clear: the greenium is thinner, and rate discipline is tighter.
After volume and composition, the next issue is simple: does green debt still mean cheaper capital? In 2026, the answer is: sometimes, but not by much. The greenium is smaller now, and it shows up on a deal-by-deal basis. Pricing depends more on leverage, PPA quality, and ITC status than on the green label itself.
The market is splitting into two pricing lanes. Utility-scale projects backed by high-credit-quality corporate PPAs can still get competitive green financing [1]. But distressed residential paper is being priced to recovery value, not to a standard greenium [2].
For growth-stage companies, that changes the math. Cost-of-capital models need to reflect current ITC eligibility and post-ITC project economics, not older credit assumptions that no longer fit the market [2].
As pricing gets tighter, investors are backing only the cleanest structures. Demand still leans toward green issuers, but it is clustering around deals with safe-harbored pipelines that locked in ITC eligibility before policy shifts under the One Big Beautiful Bill Act (OBBBA) [2].
Zelestra’s $600 million green financing facility from Societe Generale and HSBC shows how this works in practice. The deal held together because the projects were backed by long-term PPAs and a high-credit-quality offtake counterparty [1].
Pricing follows project quality, not the label.
Weak disclosure or loose use-of-proceeds tracking can wipe out any premium fast. If lenders see reporting that feels unclear, they treat it as a spread-widening event, not just a paperwork issue. In plain English: poor disclosure can directly increase your cost of capital.
Model pricing based on current ITC rules, post-ITC unit economics, and balance-sheet strength. That pricing gap is also changing who buys the paper.
That pricing shift is now showing up in who can still get a deal done. Pricing shapes cost. Buyer mix shapes access. In 2026, the pool of buyers for green debt is smaller, and access depends a lot on which part of renewable energy you're in.
The split is pretty clear. Utility-scale and C&I projects still draw strong demand. Residential solar does not.
Global banks still sit at the center of utility-scale deals, especially when those projects are backed by corporate PPAs. At the same time, large asset managers are buying more distressed assets through credit bids. Distressed residential portfolios are still finding buyers, but mostly through acquisitions rather than new financing.
For growth-stage issuers, the buyer pool is tighter than the headline market numbers make it seem. Institutional buyers also lean toward recurring O&M revenue instead of one-time construction volume, since recurring service revenue is steadier than new project flow.
The deals that draw the most competition are safe-harbored, tax-credit-eligible pipelines. Founders should focus on:
Right now, the market rewards projects with durable cash flow and fast diligence.
That concentration in bankable deals sets up the next shift: sector mix moving toward infrastructure and energy security.
The buyer mix is getting tighter, and that’s pushing money toward assets that look less like early-stage project development and more like core infrastructure.
In practice, capital is moving away from residential solar and toward utility-scale infrastructure, grid modernization, and energy-security assets. Two forces are driving that shift: policy changes to the ITC under the One Big Beautiful Bill Act, and rising demand tied to data-center load growth.
Geopolitical risk is part of the story too. Lenders are leaning harder into domestic infrastructure and grid assets. In Q2 2026, it was the most common factor lenders said would affect the economy, picked by 42.4% of respondents [3].
SOLV Energy is a clear example. The American Securities-backed platform acquired Spartan Infrastructure to add transmission and distribution capabilities to its utility-scale portfolio, and it also bought Sacramento Drilling Inc. in January 2025 [2]. At the same time, residential solar is still under strain. Freedom Forever filed for Chapter 11 in April 2026 with liabilities between $500 million and $1 billion [2].
| Solar Sector Tier | Market Status | Key Valuation Driver |
|---|---|---|
| Utility-Scale EPC | Strong / Consolidating | Backlog, O&M annuity, grid investment [2] |
| C&I / Mid-Market | Healthy | Recurring O&M, post-ITC profitability [2] |
| Residential / Distributed | Distressed | Pipeline value, workforce certifications [2] |
Infrastructure and energy-security assets are getting better pricing because lenders see them as more defensive, more domestic, and steadier on cash flow. That view is also helping larger utility platforms move closer to public markets, including SOLV Energy’s Nasdaq filing [2].
Investor demand is clustering around platforms that can prove three things: system reliability, hard collateral, and recurring cash flow.
That selectivity shows up in lender survey data. 34.0% of lenders named energy and power as a main source of volatility risk [3]. That doesn’t mean they’re stepping away from the sector. It means they’re sorting much harder within it. Projects with bankable offtake agreements, infrastructure integration, and a believable domestic supply chain story are getting the most interest.
These deals usually come with heavier diligence. Lenders want a much clearer view of workforce depth, including the number of NABCEP-certified installers and licensed electricians [2]. They’re also putting more weight on recurring O&M revenue than on pure project-contracting income [2].
That raises the reporting bar. But there’s a tradeoff: it can also help bring in investors looking for longer-duration cash flows.
Founders should position utility-scale and C&I debt around grid reliability, domestic supply-chain resilience, and recurring O&M cash flow. That’s where lender interest is heading.
This shift toward infrastructure-like cash flows also changes how long lenders may want to stay in the capital stack.
As money flows toward projects investors view as bankable, debt tenor is starting to split in two directions: short-dated paper with built-in flexibility, and longer project debt tied to steady cash flow.
You can see that split in recent deals. In July 2026, Phoenix Energy One, LLC launched "Phoenix Flex Junior Secured Notes" with investor put windows at 3, 6, 9, 12, or 18 months, carrying fixed annual rates of 6.00% to 7.00% [6]. At the other end of the market, Dimension Energy closed $650 million in construction and term financing in April 2026 for a 132 MW community solar portfolio [1]. That tells you something pretty clear: short tenors can reduce refinance exposure, while long tenors line up better with how projects earn cash over time.
Recent failures also show how fast thinly built capital structures can crack when rates stay high and policy signals get shaky.
When tenor and project timing don't line up, refinance risk goes up. If debt comes due before a project reaches steady operations, founders may have to return to market earlier than expected.
That problem gets tougher in a market where lenders are already uneasy. 32.5% of lenders now point to policy and interest rate risk as a main concern [3]. In plain English, refinance windows are less predictable. If a project's cash flow can support it, locking in a longer tenor can help cut that risk.
Investor demand is splitting by maturity profile.
Some buyers want liquidity first. They're leaning toward shorter structures with set exit points and more flexibility. Others are still open to longer-term project debt, but usually only when the deal has bankable offtake and recurring O&M revenue.
That means founders need to be clear on the audience before they shape the debt. A short flex note and a multi-year project facility may both get done, but they attract different buyers for different reasons.
The workload changes with tenor, and not in a small way.
Longer-term debt usually calls for deeper forward-looking support, including:
Shorter flex structures shift the pressure elsewhere. They need clean redemption mechanics and steady investor communication around each put window. Neither route is easy, but the paperwork and reporting path can look very different depending on the maturity profile.
Debt tenor should match the actual cash flow timeline of the project, not the timeline founders wish they had. In community solar, that often points to an 18-month development cycle and financing that fits it. In utility-scale projects with long-term PPAs, longer maturities that track the PPA term can reduce refinance gaps.
If you're raising junior private debt, put windows may help pull in investors who want flexibility without giving up yield. It also makes sense to stress-test post-ITC economics before locking in maturity.
Tenor shapes reporting cadence and covenant pressure too, which is why disclosure terms matter next.
In 2026, disclosure goes well beyond financial statements. It now covers supply-chain risk, operating performance, and tax-credit eligibility. And that shift affects two things every issuer cares about: pricing and access to capital.
One data point says a lot: 42.4% of lenders cited geopolitical risk as their leading concern when assessing borrower performance and capital availability in Q2 2026 [3]. That means issuers can’t tuck supply-chain exposure or policy sensitivity into the footnotes and hope no one notices. In this market, clear disclosure isn’t just about meeting rules. It helps shape how a deal gets priced.
Poor disclosure tends to push borrowing costs up. Lenders want quality-of-earnings (QofE) work that clearly separates EPC value from recurring O&M value. That split matters because it affects both valuation and lender confidence.
Policy qualification is getting tighter too. Issuers more often need to verify safe-harbored status and tax-credit eligibility under the Investment Tax Credit (ITC) and the One Big Beautiful Bill Act (OBBBA) [2]. If that paperwork is incomplete, lenders may treat the deal as riskier and price it that way.
As issuers edge closer to public-market expectations, investors want more than a growth story. They want disclosure on pipeline depth, revenue mix, and operating scale. Put simply, “we’re growing fast” no longer does the job on its own.
That bar also shifts by market. A company may find that one region asks for a different level of detail than another, which makes regional issuance a key part of the capital-raising plan.
Lenders are also looking hard at workforce depth, including NABCEP certifications and licensed electricians, as a sign that the business can keep projects moving and assets performing [2]. So the disclosure package for a green debt raise now needs to cover more than assets and financials. It also needs to show the team and processes behind day-to-day execution.
The workload climbs again when public-market readiness enters the picture. SEC registration and Nasdaq requirements add major governance and disclosure work, and most growth-stage teams need to map that out well before a transaction starts moving.
The biggest deal-killers are usually straightforward:
Those standards also vary by region, which can shape where U.S. issuers are able to raise capital with less friction.
In the U.S., green debt in 2026 is clustering around utility-scale projects and C&I finance. Residential and distributed assets, meanwhile, are still dealing with distress. That divide is shaping pricing across the market.
A good example is Zelestra's $600 million green financing credit facility from Societe Generale and HSBC. The facility funds two Texas solar projects with a combined 439 MW, and both projects are backed by long-term PPAs with Meta. Deals like this show where lender appetite sits right now: at the top end of the market [1].
The other side of the picture is Freedom Forever's Chapter 11 filing in April 2026. It shows how policy shifts have hit smaller installers harder than utility-scale issuers [2]. And that pressure isn't abstract. It's now showing up in lender diligence, tighter covenant terms, and a lot more scrutiny.
Lenders are pricing utility-scale deals based on PPA quality, O&M visibility, and balance-sheet strength. In plain English, they want to know the cash flows are steady, the assets can be run without surprises, and the company behind the deal can take a hit if needed.
That lens gets even tighter when you factor in market nerves. 34.0% of lenders identify energy and power as a sector likely to see significant volatility in the second half of 2026 [3]. So if an issuer can't clearly show the difference between recurring revenue and project-contracting income, lenders tend to price that risk in fast.
Institutional capital is still there, but it isn't wide open. Issuers need to show operating performance, liquidity, and safe-harbored pipelines. That's the price of entry now.
Mid-market C&I operators with strong O&M revenue are still getting attention, which matters because O&M income can help smooth out lumpier project activity. But the standard is tougher than it was 18 months ago [3].
Supply-chain exposure and equipment availability now affect both diligence and deal structure. That can shape everything from timing to reserves to how lenders frame downside protections.
The backdrop here is broader market risk. Geopolitical risk and war were cited by 42.4% of lenders as the top factor expected to affect the economy in the second half of 2026 [3]. When lenders are this alert to outside shocks, reporting quality starts to matter even more. If the numbers are messy, or if equipment timing looks shaky, the deal can get harder and more expensive.
For founders, the focus is pretty clear:
Those regional gaps now play a big role in how debt should be sized, timed, and documented. In this market, the details aren't just paperwork. They can change whether a deal gets done at all.
You can turn these seven shifts into four practical decisions: when to raise, how much to borrow, what tenor to use, and how to document the deal. The goal is simple: take market signals and turn them into a debt process you can actually run.
Time the raise. Lender sentiment is starting to steady, but conviction is still soft. That makes timing a big deal. Look for periods when credit conditions loosen for your loan size and asset type before you begin outreach.
Once you’ve picked your window, ground your plan in current comps. Benchmark pricing before launch. Non-construction bridge debt is pricing at SOFR + 300 to 350 basis points, and junior secured notes are coming in at 6.00% to 7.00%.[4][6] Put your deal next to similar issuers before you talk to lenders. Dimension Energy’s April 2026 financing gives you a useful marker for where scaled community solar is clearing today.[1]
Then line up the structure with the way the assets will produce cash. Match tenor to cash flow timing, not to the longest maturity a lender is willing to offer. The debt term should fit the point when projects begin producing steady, recurring revenue, especially O&M income. That income can support stronger valuation multiples and a steadier repayment profile.[2]
Of course, structure on paper is one thing. Diligence is where deals start to wobble. Prepare reporting before outreach. That means clean financials, a clear EPC/O&M revenue split, and lender-ready reporting should all be set up before lender conversations start, not halfway through them.
Phoenix Strategy Group helps growth-stage companies build the financial reporting, FP&A, and cash flow systems lenders expect before a raise.
These tables lay out the trade-offs in plain terms: coupon, reporting work, and refinance risk. After the seven shifts above, they help turn market signals into a simple deal screen.
| Feature | Labeled Green Debt | Conventional Debt |
|---|---|---|
| Coupon Potential | Often lower through a greenium | Market rates; often higher for distressed issuers |
| Investor Base | ESG funds and specialized banks such as HSBC, ING, and MUFG | Commercial banks, general credit funds, private equity |
| Reporting Burden | High - installed MW, estimated emissions avoided, and use-of-proceeds tracking | Moderate - standard financial covenants and DSCR |
| Covenant Expectations | Strict use-of-proceeds rules and sustainability-linked KPIs | Standard debt-service coverage and leverage ratios |
Zelestra's $600 million facility shows how much capacity green lenders can bring to a deal. That said, smaller issuers often give back some of that pricing edge through diligence and reporting work.[1]
A lower coupon sounds great on paper. But if the refinance window is off, that cheaper debt may not help as much as it first appears.
| Tenor | Refinancing Risk | Likely Investor Appetite | Fit for Asset Life |
|---|---|---|---|
| Short-term (1–3 years) | High - vulnerable to policy shifts and rate moves | Construction lenders and bridge funds | Poor - better for construction than long-lived assets |
| Medium-term (5–10 years) | Moderate - requires stable O&M cash flow at rollover | Private equity-backed lenders and commercial term lenders | Good - bridges growth phase to operational maturity |
| Long-term (15+ years) | Low - locks in cost of capital early | Institutional investors, infrastructure funds, and life companies | Excellent - matches 20- to 30-year PPA and asset life |
Mini-perm structures now fit many growth-stage issuers because they bridge construction risk and operating cash flow.
All of this points to one rule for 2026: debt will flow to issuers that show durable cash flow and tight execution. Green debt isn’t a broad expansion cycle right now. It’s a selective market. And overleveraging can hit even large operators [2].
For founders, that changes the playbook. Pricing, tenor, and disclosure now matter just as much as project quality. Growth-stage renewable borrowers will stand out only if they combine disciplined balance sheets with bankable project economics and clean reporting.
Before you launch a debt process, get the reporting and cash flow package lenders expect in place. Phoenix Strategy Group helps growth-stage renewable companies build lender-ready financials and cash flow systems.
In 2026, lenders are backing companies that keep a tight grip on the balance sheet, generate steady cash flow, and show a clear plan for handling risk.
They tend to prefer:
Most lenders also want a DSCR of at least 1.25x. And if counterparty credit is weak, they usually ask for stronger credit support.
Yes. In 2026, a green label can still help lower borrowing costs. But lenders are paying closer attention to the basics, especially debt service coverage ratios and contracted revenue.
A strong ESG framework, paired with clear data systems and solid governance, can improve access to green financing and help borrowers secure better debt terms.
Lenders want clear proof that the business can pay its bills, stay liquid, and keep operating without surprises. They look closely at off-taker credit quality, steady cash flow, debt service coverage of at least 1.25x, contract length, termination protections, and a clear view of any merchant tail exposure.
Go in prepared with at least 12 months of cash runway, clean audited financial statements, and integrated models that still make sense in downside cases. Phoenix Strategy Group can help organize that information and tighten the credit story.