Published on
August 9, 2026


Healthcare comps are only useful when the peer group is tight, the numbers are cleaned up, and the multiple matches the business. If I use the wrong peers - or mix providers, payers, and services in one set - the value range can get off fast.
Here’s the short version:
If I had to boil the whole process down, it would be this: match the company to the right sub-sector, normalize EBITDA, then apply a multiple that fits growth, margins, and reimbursement risk. That is the core of healthcare comparable company analysis.
| Segment | What I focus on first | Common valuation lens | Main risk to watch |
|---|---|---|---|
| Providers | Acuity, care setting, payer mix | EV/EBITDA in many cases | Reimbursement changes, labor pressure |
| Payers | Membership scale, product mix, MLR | EV/Revenue or EV/EBITDA, depending on earnings | Medical cost trend, product mix |
| Services / Healthtech | Recurring revenue, client concentration, tech maturity | EV/Revenue if EBITDA is weak; EV/EBITDA if steady | Revenue durability, implementation risk |
A clean comp set does not give me a single answer. It gives me a market-based range I can use with other valuation methods.
Start broad, then tighten the screen. Look first at the business model, then reimbursement profile, then size, geography, and operating metrics. After the peer set is clean, you can pick the right multiple.
The first screen is business model and care setting. Non-medical personal care, skilled medical home health, and hospice/palliative care may all sit under the home-based care umbrella, but they should not be lumped into the same comp group.
After that, use payer mix to split the field. Operators with more than 30% of revenue from private-pay or Medicare Advantage usually trade at a 0.5x–1.0x premium versus Medicaid-dependent peers. [1]
Then narrow the list by size, geography, and operating profile. Geographic density matters a lot. Regional footprints in the same state or in contiguous counties often support better margins. In home care, EBITDA margins typically land at 10%–15%. Top-quartile operators can hit 18%–25%, and turnover is a helpful screen for labor stability. [1]
For providers, the two filters that matter most are acuity and reimbursement mix. Medical home health and non-medical personal care are not interchangeable peers. Medical home health usually trades at 3x–6x EBITDA for smaller operators and 9x–12x+ for scaled platforms, while non-medical personal care tends to trade at 5x–8x EBITDA. [1]
Hospice also needs its own peer group because its economics differ from both medical home health and personal care. Hospice care often posts gross margins of 25%–35% and EBITDA margins of 15%–20%. [1]
For payers, screen by membership scale, product mix, MLR, and value-based care exposure. If the payer is integrated, also look at provider ownership and cost-control ability. [1]
Healthcare services and healthtech companies need a different lens. The main question is simple: How does the company make money, and how steady is that revenue?
For RCM and healthtech, screen for recurring revenue, implementation length, customer concentration, and tech maturity when those factors affect growth or margins in a meaningful way. [1]
Staffing and other volume-driven services businesses also need a careful filter. The peer set should match labor intensity, revenue predictability, and automation. That group will shape the EV/Revenue and EV/EBITDA range in the next section.
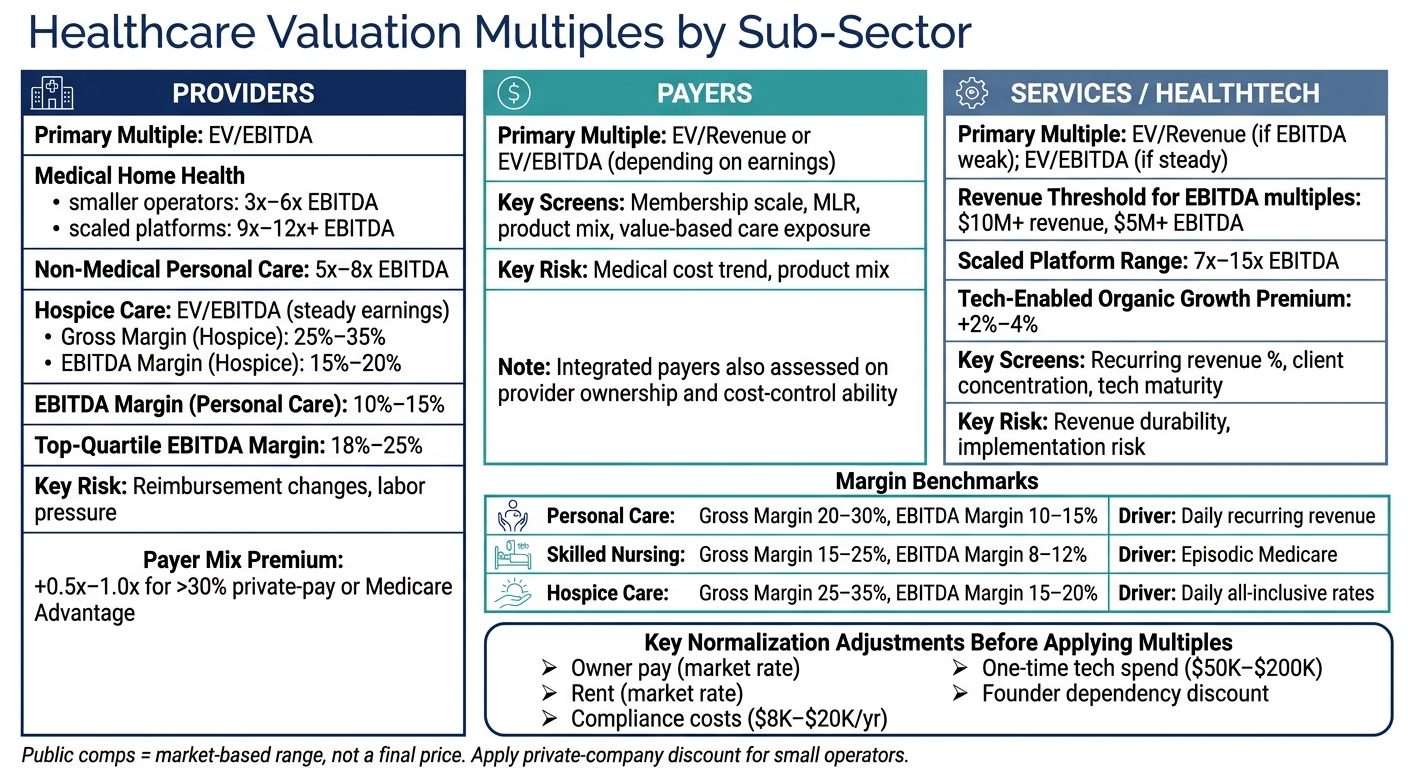
Healthcare Valuation Multiples by Sub-Sector: Providers, Payers & Services
Once you’ve built the peer group, the next step is turning those comps into the right earnings multiple. The process is pretty simple on paper: pick the metric, clean up the financials, then line the company up against public comps.
After the peer set is in place, choose the multiple that fits the business’s earnings profile.
Use EV/EBITDA for established businesses with steady earnings. Use EV/Revenue when EBITDA is thin, volatile, or negative. If EBITDA is near zero or below zero, revenue is usually the cleaner yardstick.
Scale matters too. As a business grows past $10 million in revenue with $5 million+ in EBITDA, buyers tend to move toward EBITDA multiples. For scaled home care platforms, those multiples have ranged from 7x to 15x.[1]
Once you’ve picked the metric, use growth and margin to decide where the company fits inside that range.
Growth, payer mix, and margin shape where a company lands within the peer range.
Payer mix can shift a company up or down inside that range. Tech-enabled operators using integrated EHR, AI scheduling, or remote monitoring can also support a +2% to 4% organic growth premium.[1]
Even similar healthcare businesses don’t trade the same way. Why? Because margin profile and revenue quality can look very different from one subsector to another. Here’s how that plays out:
| Service Type | Avg. Gross Margin | Avg. EBITDA Margin | Primary Driver |
|---|---|---|---|
| Personal Care | 20–30% | 10–15% | Daily recurring revenue [1] |
| Skilled Nursing | 15–25% | 8–12% | Episodic (60-day) Medicare [1] |
| Hospice Care | 25–35% | 15–20% | Daily all-inclusive rates [1] |
Turnover also matters. High caregiver turnover tends to pull multiples down, and home care turnover averages 79% annually.[1]
Before you apply any multiple, clean up earnings so they reflect what a buyer would pay for, not just what the current owner reports. That means adjusting for items like:
If the business depends heavily on the founder, apply a valuation discount for transition risk.[1]
The goal is to get to a buyer-underwritten EBITDA figure. Use those normalized numbers in the comp table that follows.
Once buyer-underwritten EBITDA is set, the next move is to pull public-market data and build a comp table you can actually use.
Start with SEC filings. 10-Ks give you annual financials, and 10-Qs fill in the quarterly picture. Earnings releases and investor presentations help round that out with reported numbers and company-adjusted results.
For healthcare, that’s only part of the story. CMS reimbursement data and payer or membership data add the context you need. They help you compare companies based on how revenue is generated, not just how big the business looks on paper [2].
Take those inputs and put them into one standard table so every peer is judged on the same basis.
| Category | Key Fields to Include | Purpose |
|---|---|---|
| Company Info | Name, ticker, sector/segment, HQ location | Identifies and groups peers |
| Market Data | Share price, market cap, net debt, enterprise value (EV) | Anchors valuation |
| Financials | LTM and FY revenue, gross profit, EBITDA, EBIT, net income, FCF | Provides the performance base |
| Growth Rates | Revenue growth %, EBITDA growth % | Shows momentum |
| Margins | Gross margin %, EBITDA margin %, net margin % | Shows operating efficiency |
| Multiples | EV/Revenue, EV/EBITDA | Shows relative valuation |
| Operational KPIs | Revenue per employee, payer mix, membership profile | Captures healthcare-specific drivers |
Group the table by segment - Providers, Payers, and Services. That matters because these segments trade differently based on revenue quality, margin profile, and reimbursement mix [2].
It also helps to add an operational notes column. That’s where you can flag details like payer mix or membership profile. If consensus estimates are available, include forward figures such as 2027E [2].
One big watchout: asset-heavy REITs, providers, and service businesses often trade on very different metrics. So segment labels and operating notes aren’t just nice to have - they keep the table from turning into apples-to-oranges math.
Use the table as a range, then pressure-test it against the limits of healthcare comps.
A well-built comp table gives you a starting range, not a final answer. Trading comps show how the market priced similar companies on a specific date. That matters, because market pricing can drift far from what a private business is worth in an actual deal.
Scale is the first thing to check. Public and private businesses almost never trade on the same earnings base. The biggest issue is simple: scale mismatch. Public comps often overstate smaller private operators because the size of the business and the pool of buyers are different. In plain English, if you slap a public multiple onto a small private company, you’ll often end up too high.
Reimbursement can throw things off too. The CMS 2026 Home Health PPS Final Rule included a 1.3% payment reduction [1]. If a peer’s multiple was set before that cut, the number may not match current conditions.
Growth path is another trap. A company built through acquisitions can earn a different multiple than one built through de novo expansion, even when top-line revenue looks similar. Put those businesses in the same peer group, and the output can get messy fast.
Before using the range, do one last screen for referral concentration and source quality. Referral control can support a premium that public comps may not pick up.
Before you use any multiple from your comp table, check the basics:
Trading comps are one market-based input. Use them alongside other valuation methods before making a call on value.
For a reliable comparable company analysis, 5 to 10 companies is usually enough.
That range tends to give you enough data to spot patterns and draw useful insights without stuffing the analysis with companies that don’t fit well.
Pick too few, and the data can feel shaky. Pick too many, and the valuation can get watered down by less relevant or skewed results. The aim is simple: balance the number of companies with how closely they match the business you’re valuing.
Discount public multiples when valuing private companies to reflect different risk and operating profiles. A lack of marketability discount - often 20% to 50% - accounts for the lower liquidity of private shares.
You’ll also want to adjust for size differences, lack of control in minority stakes, and gaps in financial transparency, capital structure, and growth prospects compared with public peers.
A healthcare peer set makes sense when the companies operate in the same industry and face a similar reimbursement or regulatory setting. They should also use comparable business models and revenue streams, and line up with the target’s size and profitability. In practice, that usually means staying within about ±20–30% for scale and looking for similar margins.
The peer set should also use current, standardized data from public markets or deals. Just as important, the analysis needs to apply the same normalization across the group for growth, risk, and non-recurring items. And it can’t sit still for long. Reimbursement and regulatory shifts can change the picture fast, which makes older comps less useful.