Published on
August 21, 2026


One worker leaving can cost far more than hiring a replacement. I’d sum it up this way: CFOs usually model turnover in three parts - how many people leave, what each exit costs in cash, and what the plant loses in output and margin while the new hire ramps up.
If I were explaining the article in plain English, I’d say you should track:
The math is simple:
A small example shows why this matters. If a plant has 200 operators, 25% turnover, and $12,500 in total cost per exit, that’s 50 departures and $625,000 per year in turnover cost for that role alone.
What I like about this model is that it ties HR activity to plant finance. You’re not just counting exits. You’re showing how turnover hits labor cost, scrap, throughput, unit economics, margin bps, and forecast variance.
Here’s the short version of the full article:
In other words: turnover is not just an HR metric. It’s a margin issue. This article shows how I’d turn exits on the floor into a dollar figure finance can use in budgets, board updates, and monthly FP&A reviews.
Build the model in four buckets: separation, recruiting and hiring, training, and vacancy coverage. Pull data from HRIS, payroll, accounts payable, and time logs. Then convert each cost into a fully loaded dollar amount.
Use these direct-cost inputs first. After that, you can estimate the hidden margin loss.
Start with a 12-month measurement period that matches your fiscal year. Pull average headcount and separations by role from your HRIS or payroll system. Then divide separations by average headcount to calculate turnover rate by role.[6]
Separation cost includes internal labor time plus any payout. A typical departure takes about 2 to 3 hours of HR time and 3 to 5 hours of supervisor time for exit interviews, paperwork, and coordination. Use fully loaded labor rates, including benefits and payroll taxes. Then add severance or unused PTO payout.
Here’s a simple example:
That puts separation cost at $650 per departure. At 50 departures per year, total separation cost comes to $32,500.
Once you’ve priced separation cost, move to recruiting, onboarding, and training.
This bucket should tie back to vendor invoices and internal time logs. For a production operator role, include job board postings at $300 to $600 per open role, screening and interview time of 5 to 10 hours split between HR and the hiring supervisor at their fully loaded rates, background checks and drug screens at $50 to $150 per candidate, and any sign-on or referral bonus of $500 to $1,000 in tight labor markets. Onboarding administration adds another 2 to 3 hours of HR time.
For skilled technician roles, agency fees can change the math in a big way. If a staffing agency charges 15% to 25% of first-year salary on a $50,000 technician hire, that adds $7,500 to $12,500 per placement. Model operators, technicians, and supervisors separately, because agency fees and screening effort vary by role.
After hiring spend is loaded, price training and vacancy coverage.
Training cost per hire has four parts: trainer labor hours, trainee nonproductive hours, materials and consumables, and machine downtime for training runs.
For a new line operator, a standard training path might look like this:
That brings training cost to about $2,050 per hire for that role.
Vacancy coverage is a separate cost driver, and it’s often the first one teams feel. Model it by turning vacancy days and coverage hours into dollars using fully loaded labor rates, units per hour, and contribution margin per unit.[4][5] Start with lost contribution margin. Then subtract any output recovered through overtime or temp labor.
If you backfill with overtime, count only the overtime premium, not the base wage that’s already covered elsewhere in labor cost. Model temp agency markups on their own.
These direct costs set the floor. Next, layer in output loss, defects, and overtime pressure.
Once you’ve priced direct costs, the bigger margin drain often comes from the stuff that’s easier to miss. In many plants, hidden losses end up costing more than hiring itself.
The main buckets are ramp-up output loss, quality defects and rework, and overtime and temp labor premiums. Track each one on its own for operators, technicians, and supervisors. Why? Because ramp speed, error rates, and coaching needs can vary a lot by role.
New hires almost never perform at full speed on day one. In U.S. discrete manufacturing, a practical ramp-up window is often 4 to 12 weeks for basic assembly roles and as long as 6–12 months for skilled machining or maintenance positions. Instead of using a flat line, break the ramp into three stages: weeks 1–2 at about 40–60% of standard output, weeks 3–6 at 70–85%, and weeks 7–12 getting close to 90–100%.[7][8][9]
To turn that output gap into dollars, use a simple formula: Foregone margin = 30 missing units per shift × $8 contribution margin × 60 shifts = $14,400 per hire.
Pull the inputs from your MES, time-and-attendance system, and standard cost reports. It helps to split the data by tenure band:
That gives you a cleaner view of how output changes over time instead of relying on guesswork.
Once output starts to recover, quality loss usually becomes the next problem.
New workers tend to create more scrap. Research shows new employees make about 3× more quality errors in their first 90 days than experienced peers.[10]
At the plant level, compare defect rates for new hires against experienced workers over the first 60–90 days. Say experienced operators run a 2% scrap rate and new hires run 6% on a line producing 200,000 units per quarter at a $4 unit cost. That extra 4% scrap equals 8,000 units, which adds $32,000 in production cost. If those units are scrapped, the incremental 8,000 units add $32,000 in production cost.
If rework is possible, add labor on top. At 0.3 rework hours per defective unit and a $28/hour blended labor and overhead rate, 8,000 units creates $67,200 in rework labor alone.
Supervisor time matters too, and it gets missed all the time. A fair starting point is 3 hours per week of coaching per new hire for the first 8 weeks. At a $45/hour fully loaded supervisor rate, 10 new hires at once cost $10,800 in direct supervisor time. That’s time pulled off process improvement and throughput work.
| Cost Category | Driver | Data Source | Typical Financial Effect |
|---|---|---|---|
| Scrap and defects | Defect rate differential (new vs. experienced) | Quality logs, scrap tickets, MES reports | Higher COGS per unit; inventory write-offs |
| Rework labor and materials | Rework hours per defective unit; consumables | Work orders, labor tracking systems | Added direct labor cost and lost capacity |
| Supervisor/lead oversight | Coaching hours per new hire; floor interventions | Supervisor timesheets, daily management logs | Diverted time from process improvement and throughput |
And when those gaps show up on the floor, labor cost usually gets hit again through overtime or temp coverage.
When a seat stays open or a new hire is still getting up to speed, somebody else has to carry the load. Most of the time, that means overtime or temp labor.
For non-exempt hourly employees in the U.S., overtime is paid at 1.5× the regular rate after 40 hours. If a line operator earns $24/hour base, overtime costs $36/hour. Covering one vacancy with 10 overtime hours per week across existing staff for 12 weeks adds $1,440 in incremental overtime premium for that one departure. And that doesn’t include fatigue-related quality or safety problems.
Temp labor can look cheaper at first glance, but the math usually says otherwise. U.S. manufacturing temp bill rates often run 10–40% above the equivalent base wage because of agency markup. If regular employees cost $30/hour fully loaded and a temp bills $39/hour, that’s a $9/hour markup before you even factor in output loss.
Temps also often run at about 85% of standard output during their first month, which pushes up the cost per unit produced. To keep the model clean, apply both the pay premium and the output loss to vacancy duration and ramp-up time so overtime and temp coverage sit inside the same cost framework.[10]
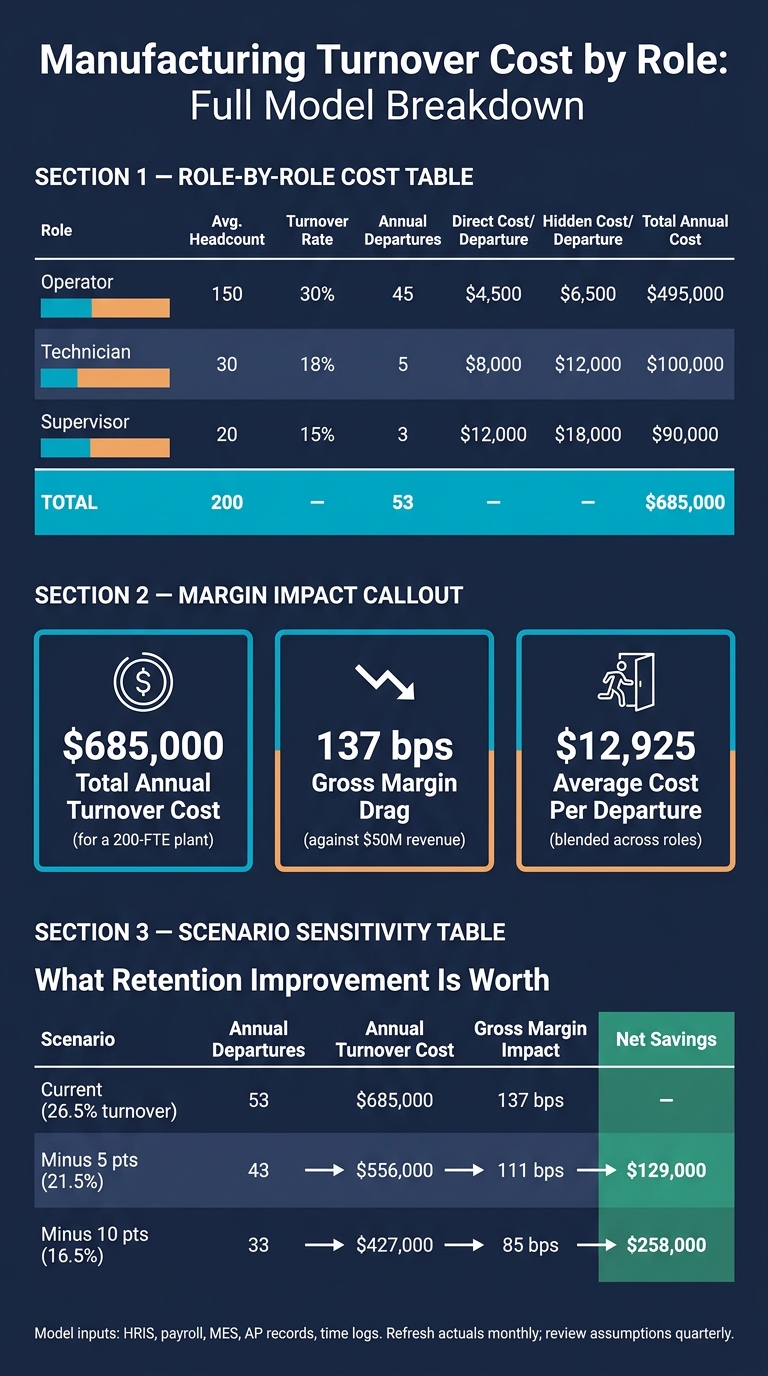
Manufacturing Turnover Cost Model: Direct vs. Hidden Costs by Role
Once you've built the per-departure cost for each role, the next move is to turn those figures into a plant-level view that finance, operations, and the board can all use.
Start with the per-departure costs and build a plant-level total. Roll each role's departures into a facility total, and do it separately for operators, technicians, and supervisors because the cost drivers are not the same. A supervisor departure may involve fewer events per year, but it can still cost 100–150% of annual salary once you include team disruption and scheduling gaps.[11] An operator departure may seem less expensive on its own, but at scale it adds up fast. For example, a plant with 200 production FTEs and 28% annual turnover has 56 exits, and at $7,800–$11,900 per departure, annual turnover cost comes to $436,800 to $666,400.[2][1]
Add up the direct and hidden costs you've already built, then roll them up by role and facility. Here's one sample role-level layout using example assumptions for a single facility:
| Role | Avg. Headcount | Turnover Rate | Annual Departures | Direct Cost/Departure | Hidden Cost/Departure | Total Annual Cost |
|---|---|---|---|---|---|---|
| Operator | 150 | 30% | 45 | $4,500 | $6,500 | $495,000 |
| Technician | 30 | 18% | 5 | $8,000 | $12,000 | $100,000 |
| Supervisor | 20 | 15% | 3 | $12,000 | $18,000 | $90,000 |
| Total | 200 | 53 | $685,000 |
If you run more than one site, break this out by facility, shift, and department. One line or one site often accounts for most of the cost, and you won't spot that if everything is lumped together.
This total is the bridge between workforce turnover and margin. Divide annual turnover cost by revenue to estimate how many basis points of gross margin it eats up. In the example above, $685,000 of turnover cost against $50 million in revenue equals 137 basis points of gross margin drag before any secondary throughput or quality losses.
It also helps to show cost per unit so turnover ties back to unit economics. For EBITDA, split out the costs that sit in COGS - overtime premiums, temp labor, scrap, and rework - from recruiting and training spend that may sit in SG&A. Report both the dollar impact and the margin bps so leaders can see earnings pressure fast.
A scenario table turns the model into a tool people can act on. Use three cases: current turnover, a 5-point reduction, and a 10-point reduction. Then show what each case means for annual cost, cost as a percent of payroll, gross margin, and EBITDA. If a retention program costs $100,000 and saves $250,000 in turnover cost, the ROI is simple to explain.
Assuming the role mix and cost per departure stay flat, the sample plant above would look like this:
| Scenario | Annual Departures | Annual Turnover Cost | Cost as % of Payroll | Gross Margin Impact | EBITDA Impact | Net Savings vs. Current |
|---|---|---|---|---|---|---|
| Current (weighted 26.5%) | 53 | $685,000 | - | 137 bps | Depends on COGS vs. SG&A treatment | - |
| −5 pts (21.5%) | 43 | $556,000 | - | 111 bps | Depends on COGS vs. SG&A treatment | $129,000 |
| −10 pts (16.5%) | 33 | $427,000 | - | 85 bps | Depends on COGS vs. SG&A treatment | $258,000 |
Fill in the payroll column with your actual wage base. EBITDA will shift based on COGS vs. SG&A treatment.
You can use the same output in monthly FP&A reviews to track actuals, forecast savings, and measure retention ROI. Feed these scenarios into FP&A so monthly variance reviews show the cost of turnover in real time.
Once you’ve priced both direct and hidden turnover costs, the next step is putting the model to work in FP&A.
Pull inputs from HRIS, payroll, MES or production data, and timekeeping. Each system should use the same employee ID and plant ID so you can join records cleanly and avoid messy mismatches.
Keep every assumption in a single log. For each one, note:
Refresh actuals every month by loading new departures, hires, overtime hours, and production output. Then review and update the structural assumptions at least every quarter so the model stays in line with current operating conditions.
If you launch a new training program or make another material operational change, update the log and record the effective date. That way, when someone asks why the numbers shifted, you’re not left guessing.
When data sits across separate systems, model upkeep often comes down to data integration and steady reporting. For growth-stage manufacturers dealing with fragmented systems, Phoenix Strategy Group can help build the data and FP&A layer needed to turn turnover analysis into a driver-based model.
The minimum setup is simple: use a straightforward model, document assumptions, update it quarterly, and refresh it in monthly FP&A.
You need a credible model - credible enough to size retention investments, justify staffing decisions, and show the board what workforce instability actually costs the business.[3] Use it in every monthly review to track actual turnover cost against forecast.
Start with past labor costs and turnover metrics. That means base pay, benefits, overtime history, replacement and training costs, and productivity gaps.
Then pull in the numbers behind the labor model: fully burdened labor rates, workable hours assumptions - often 2,080 hours per FTE, minus PTO, holidays, training, and admin time - plus overtime patterns by department or shift and new-hire ramp-to-productivity assumptions.
Why does this matter? Because labor costs on paper and labor costs in practice are rarely the same. A $25/hour role doesn’t stay $25/hour once benefits, lost time, overtime, and ramp-up drag enter the picture. If you skip those inputs, the math can look clean while the plan falls apart in day-to-day use.
Estimate hidden turnover costs by modeling the direct cost to replace someone and the lost output that comes with the change.
Start with the employee’s fully burdened hourly labor cost. Then add recruiting spend, plus onboarding or training hours based on your own turnover history.
Next, turn ramp time into lost production. The idea is simple: estimate how much output you lose while the role is not yet fully productive.
If turnover leads to overtime, count the extra costs that come with it, not just the added wages. That can include:
Turnover hits gross margin from both sides.
On the cost side, it pushes labor and COGS up because replacing people costs money. So does training them. Then there’s the gap before a new hire gets up to speed, which often means lower output. If the team has to cover the shortfall, overtime and other labor inefficiencies can pile up too.
It also drags on EBITDA. The same turnover-related costs show up as higher operating expenses, including hiring, training, hidden payroll-related costs, and downtime that doesn’t come with better productivity or stronger pricing to make up for it.