Published on
August 31, 2026


If you wait until month-end to check margin, you’re already late. In logistics, profit can slip fast when fuel changes, carrier rates move, detention grows, or empty miles stack up. A live embedded dashboard helps me track margin at the shipment level, then roll it up by lane, customer, and mode so I can spot issues the same day.
Here’s the short version:
A good dashboard does not just show revenue minus carrier cost. It also helps me account for detention, fuel, tolls, deadhead, planning labor, and overhead. That matters when trucking costs run around $2.27 to $2.336 per mile and even one missed cost line can change whether a lane makes money.
I’d break the setup into five parts:
Here’s a quick view of the three margin types:
| Margin Type | What It Includes | Best For |
|---|---|---|
| Gross margin | Revenue minus direct shipment cost | Daily pricing and dispatch |
| Contribution margin | Gross margin minus load-level working costs | Lane and short-term contract review |
| Fully loaded margin | Contribution margin minus allocated overhead and empty-mile burden | Customer, network, and company planning |
So if I want a dashboard that people will trust, I need clean joins, one metric policy, fast refreshes, and drill-downs that make it easy to trace a weak lane back to the exact shipments causing it.
Use shipment-level joins and clear definitions so the data is fit for analysis.
Three systems do most of the work here: your TMS, your ERP, and your CRM or contract system.
Those records feed the live lane, customer, shipment, and mode views used later in the dashboard.
Join all three systems on shipment or load ID. That one key links the carrier cost from the TMS, the customer invoice from the ERP, and the contracted rate from the CRM.
Reconciliation is where hidden margin leaks start to show up. TMS-only margin views are often overstated because costs like factoring fees, which run 2% to 4% per invoice, live only in accounting data. AP reconciliation against rate confirmations and TMS load data also tends to expose carrier payment gaps and unbilled detention that stay invisible until the systems are checked side by side.[1]
Once the data is joined, set a refresh cadence that lines up with how fast teams need to act.
Refresh data every 15 to 60 minutes, based on who is using it. Dispatch, pricing, and FP&A don't all work at the same pace, and the refresh rate should match that. When it does, pricing and dispatch decisions can still happen within the same workday.
That kind of update cycle usually calls for incremental ETL or ELT pipelines, not nightly full-load jobs. It also helps to flag unmatched shipments, billing in progress, and margin outliers by lane or mode. And every view should show a Last updated timestamp in MM/DD/YYYY HH:MM AM/PM format, so no one has to guess how current the numbers are.
With the data layer and refresh timing set, the next piece is the margin model itself.
That model only works if the data stays reconciled. Phoenix Strategy Group can build the integrations, canonical shipment model, and reconciliation rules behind the margin layer. Their FP&A and data engineering teams can also set the allocation rules for overhead and indirect costs, so dashboards show both direct and fully loaded margin without mixing cost categories or double-counting. That gives finance one auditable margin number instead of conflicting outputs from different systems.
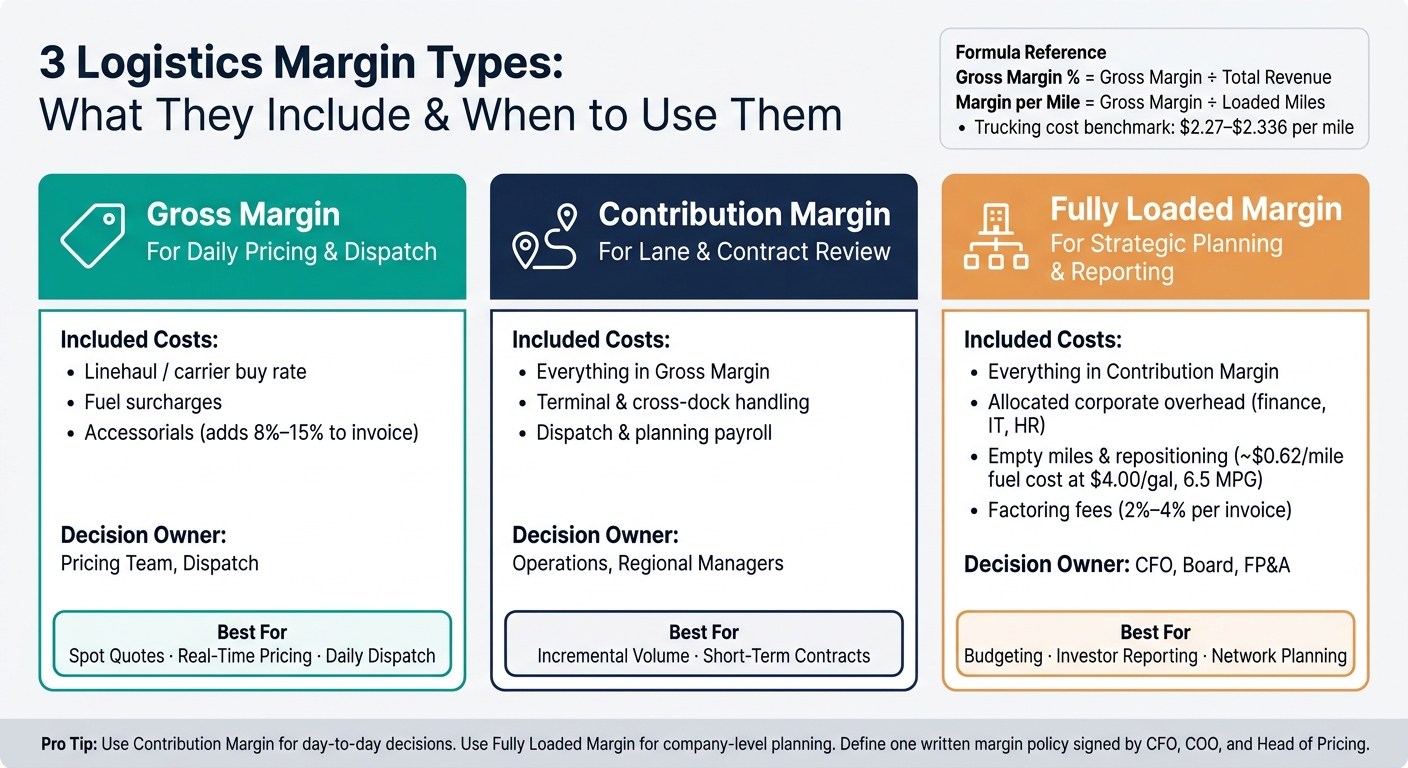
3 Logistics Margin Types: What They Include & When to Use Them
Turn reconciled shipment data into one margin model that feeds every dashboard view. Then use that same base to set one calculation logic across the board.
That matters more than it sounds. If one dashboard uses one formula for margin and another uses a slightly different one, people stop trusting the numbers. The fix is simple: build the logic once in your transformation layer - whether that’s a dbt model or a BI semantic layer - so the calculation stays the same no matter which view someone opens.
Start at the shipment level. Calculate each metric there first, then roll those numbers up by lane, customer, and mode.
Track:
Each one answers a different business question. Gross margin shows raw dollars. Margin percentage helps compare unlike shipments. Margin per mile shows how well distance turns into profit. Margin per stop can expose routes that look fine at a high level but fall apart once extra stops eat into the job.
Direct costs are usually the easy part. Indirect costs - dispatch payroll, terminal handling, deadhead miles, and repositioning moves - need clear rules.
Set up GL-based cost pools, then map each pool to a driver that matches how the cost happens.
| Cost Pool | Recommended Driver | Why It Fits |
|---|---|---|
| Dispatch & planning payroll | Shipment count or hours worked | Scales with workload and load volume |
| Terminal & cross-dock facility | Shipment count or weight (lb) | Reflects handling events and freight density |
| Deadhead & repositioning | Miles (loaded + empty) | Ties fuel and driver cost directly to network movement |
| Corporate overhead (finance, IT, HR) | Revenue share | Allocates proportionally to commercial scale |
Push those allocated costs down to the shipment record. That way, every filter, card, and drill-down shows the same fully loaded margin instead of a half-finished version.
For example, if dispatch payroll is $25,000 for a week across 250,000 total miles, each shipment absorbs $0.10 per mile as an allocated dispatch cost.[4]
Empty miles matter too. At $4.00 per gallon and 6.5 MPG, each empty mile adds about $0.62 in fuel cost.[2][3] If your margin model skips empty miles, lane profitability will look better on screen than it does in the bank account.
Use one written policy to decide which margin definition runs pricing, operations, and reporting.
| Margin Type | Included Costs | Typical Use Case | Decision Owner |
|---|---|---|---|
| Gross margin | Direct variable costs only (linehaul, carrier buy, fuel, accessorials) | Spot quotes, real-time pricing decisions, daily dispatch | Pricing team, dispatch |
| Contribution margin | Direct costs + operating costs (terminal handling, dispatch labor) | Evaluating incremental volume on existing lanes, short-term contract decisions | Operations, regional managers |
| Fully loaded margin | All of the above + allocated corporate overhead, empty miles, repositioning | Strategic lane and customer portfolio reviews, budgeting, investor and lender reporting | CFO, board, FP&A |
Keep the rules in writing. Use contribution margin for day-to-day decisions and fully loaded margin for planning at the company level. Before launch, require a written margin policy signed by the CFO, COO, and head of pricing.
These metric definitions should feed the KPI cards, filters, and drill-downs in the dashboard layout.
Once your margin model is set, the dashboard layout decides whether people will use it or ignore it. The job here is simple: give users a clear path from company-wide numbers down to one shipment, without making them click through a maze. Every view should reflect the same shipment, lane, customer, and mode logic already defined in the margin model. Start with the pieces people check first: filters, KPI cards, and ranked profitability views.
Place filters at the top of the page first: date range, customer, and region. Every chart, table, and card should react to those filters right away. If the filters lag or only update part of the page, people lose trust fast.
Use five to seven KPI cards so the page stays easy to scan. Lead with margin, then show volume and exception context. That order matters. People should see financial performance before they dig into activity or problem counts.
Put ranking charts and profitability tables under the KPI cards. This gives users a clean top-to-bottom flow: headline numbers first, then the drivers behind them. Any metric below your margin threshold should be color-coded so problem areas stand out without extra clicks.
Keep drill paths one click deep: summary → filtered list → shipment detail. That’s the sweet spot. Anything more starts to feel like work.
When a user clicks a lane in the ranking chart, send them to a filtered shipment list that shows the related financial and operational details. Keep the filters in place and let them stay in the same view. The same pattern should apply to customer-level drill-downs, ending at shipment detail.
Different teams need different things from that path:
If both groups use the same dashboard, the path can stay the same even if the starting point changes.
Different roles need different default views. The margin logic should stay the same across roles, but the opening view should change based on the job. An executive shouldn’t land on the same screen as a dispatcher. Role-based defaults help each user start with the metrics tied to the decisions they make.
| Widget Name | Primary User | Decision Supported | Data Grain | Update Frequency |
|---|---|---|---|---|
| Margin KPI Cards | Executive / Finance | Overall profitability health | Aggregate (Company-wide) | Real-time |
| Lane Ranking Chart | Finance / Operator | Resource allocation & pricing | Lane / Route | Real-time |
| Customer Profitability Table | Finance / Sales | Contract renegotiation | Customer / Account | Real-time |
| Shipment Exception List | Operator | Immediate operational intervention | Individual Shipment | Real-time |
| User View | Typical Filters | Default Metrics | Drill Targets |
|---|---|---|---|
| Executive View | Date Range, Region, Business Unit | Total Revenue, Gross Margin %, Margin $ | Customer-level profitability |
| Finance View | Customer, Lane, Mode | Margin per Mile, Cost Variance | Shipment-level cost details |
| Operator View | Carrier, Status, Exception Type | SLA Compliance, On-Time In Full, Margin | Shipment exceptions & accessorials |
Use the same universal ID in every drill target.
Once the dashboard is in place, the next move is simple: use live margin data to transform your operations and make pricing and finance calls faster. Static reports tell you what already happened. Live dashboards help teams act the same day.
The 30-day view helps spot early trouble, like a lane where costs are climbing faster than revenue. The 60-day view shows whether that issue is sticking around. The 90-day view brings deeper problems into focus, such as weak contracts, chronic underpricing, or a freight mix that’s shifting toward lower-margin modes.
Each time window should lead to a clear next step. Say a lane’s margin falls from 15% to 8% over 30 days while volume stays flat. In that case, pricing can pause discounts, check the carrier mix, and reprice the lane before the next month starts.
Live dashboards also help with accrual checks and run-rate forecasts. Finance can compare accrued cost per shipment with posted carrier invoices. If that gap starts getting bigger, the dashboard flags it in the middle of the month instead of waiting until close. FP&A can also compare the current run rate against budget in real time.
Those signals matter only if someone owns them and knows what to do next.
Set clear thresholds and tie each one to a named owner. A practical starting point looks like this:
Ownership needs to be explicit. Finance/FP&A checks the signal and logs it in a margin exception register. Pricing owns rate and discount changes and uses dashboard data to back up the change. Operations owns route and carrier changes to cut empty miles or detention. Account management handles customer discussions before any rate change goes live.
A weekly margin committee that reviews alerts with more than $25,000 in monthly impact can keep the process steady. Every alert should have a named owner, and every outcome should be logged in the margin exception register.
A margin dashboard that actually changes decisions comes down to five things: agree on one margin framework across finance and operations, unify TMS and accounting data, model every metric at the shipment level before rolling it up, build drill-down paths that take users from KPI cards to shipment detail fast, and connect live margin views straight to pricing reviews, forecast updates, and monthly close.
Skip the data unification work, and the dashboard numbers won’t match the general ledger. Skip the shipment-level model, and the lane rankings won’t hold up under scrutiny.
Include all costs tied to moving a load. Start with fully loaded costs like fuel, maintenance, and paid driver time.
If you want a closer look, add direct service costs, variable selling and distribution costs, and idle costs. Use invoice-level data so you can tie each cost to a specific shipment, customer, or lane.
A margin dashboard should refresh based on how fast your team needs to react to changes in financial data. Some metrics make sense to review daily or weekly. Others may need hourly updates so people can make faster calls.
You can automate updates on a set schedule, such as every 15 minutes, or trigger them when specific operational events happen. Phoenix Strategy Group advises that real-time monitoring works best when dashboards load in just a few seconds.
Modeling margin at the shipment level first shifts reporting from high-level summaries to granular, usable data. When you work from invoice- and order-level records, you can tie costs to specific activity and spot margin leakage that often stays buried in rolled-up P&L statements.
It also shows which shipments, customers, and lanes make money and which ones drag performance down. That gives finance teams the detail they need to make better calls on pricing, contract renewals, and day-to-day operational changes.