Published on
September 8, 2026


More sales can leave me with less cash. That happens when I pay people, vendors, and software bills now, but customers pay 30, 45, or 60+ days later.
Here’s the short version:
A few numbers stand out:
So if I want growth without cash stress, I need to watch:
This article shows how I’d find the bottleneck, measure what it costs, and fix the one that traps the most cash first.
Cash problems usually begin in the workflow, not in the bank account itself. Slow approvals and late invoices stretch the gap between booked revenue and money in hand. In most companies, the biggest drains show up in sales and delivery, finance, and staffing. So the job is pretty simple: find the exact point in the process where cash gets stuck.
When a sales rep needs days to turn around a quote, the deal closes later. Then everything after that moves later too. Contract holdups make it worse. If legal is short on staff or contract terms vary from deal to deal, a verbal “yes” can sit in limbo for weeks before billing even starts.
Delivery issues create the same kind of drag. If orders are waiting on warehouse space or missing inventory, they can’t ship. And if the business invoices only after shipment or delivery confirmation, cash gets pushed out with them. Poor demand forecasting can lead to stockouts, which either stop shipment altogether or force split deliveries that delay billing. In plain English: every delay in fulfillment moves cash receipts farther down the road.
Even after the work is done, cash can still stall inside finance. A 2024 Atradius study found that 25% of B2B invoices are sent more than one week after service delivery[1]. At $1,000,000 in monthly revenue, that kind of lag can tie up about $233,000 in cash.
Collections can turn into a mess too. Without a set follow-up rhythm - grouped by customer risk, with reminders scheduled before and after due dates - past-due balances start aging into 60-day and 90-day buckets. Research cited by the Credit Research Foundation shows that an invoice at 90 days past due has only a 69.6% probability of collection, dropping to 52.1% at six months[2][3]. That’s a sharp drop, and it shows how fast delay turns into loss.
Billing disputes add another layer. Once an invoice is contested, payment is often paused until the issue is fixed. That creates a gap between expected cash and actual cash. On the payables side, paying vendors before terms require does the opposite kind of damage: it sends cash out sooner than it needs to go. That’s why billing and collections are usually the first place worth measuring.
Thin operations teams slow everything down. Orders stack up, service tickets sit longer, and project milestones slip. When that happens, invoicing slips too.
A short-staffed finance team can make the problem even worse by falling behind on billing, cash application, and collections follow-up. That pushes receipts out even more.
Fast hiring can strain cash right away. Payroll and benefits hit on a biweekly or semi-monthly schedule, while new sales hires often need three to six months to ramp. During that window, burn goes up before the new revenue shows up.
Once you spot where the delay begins, you can put a dollar figure on what it’s costing.
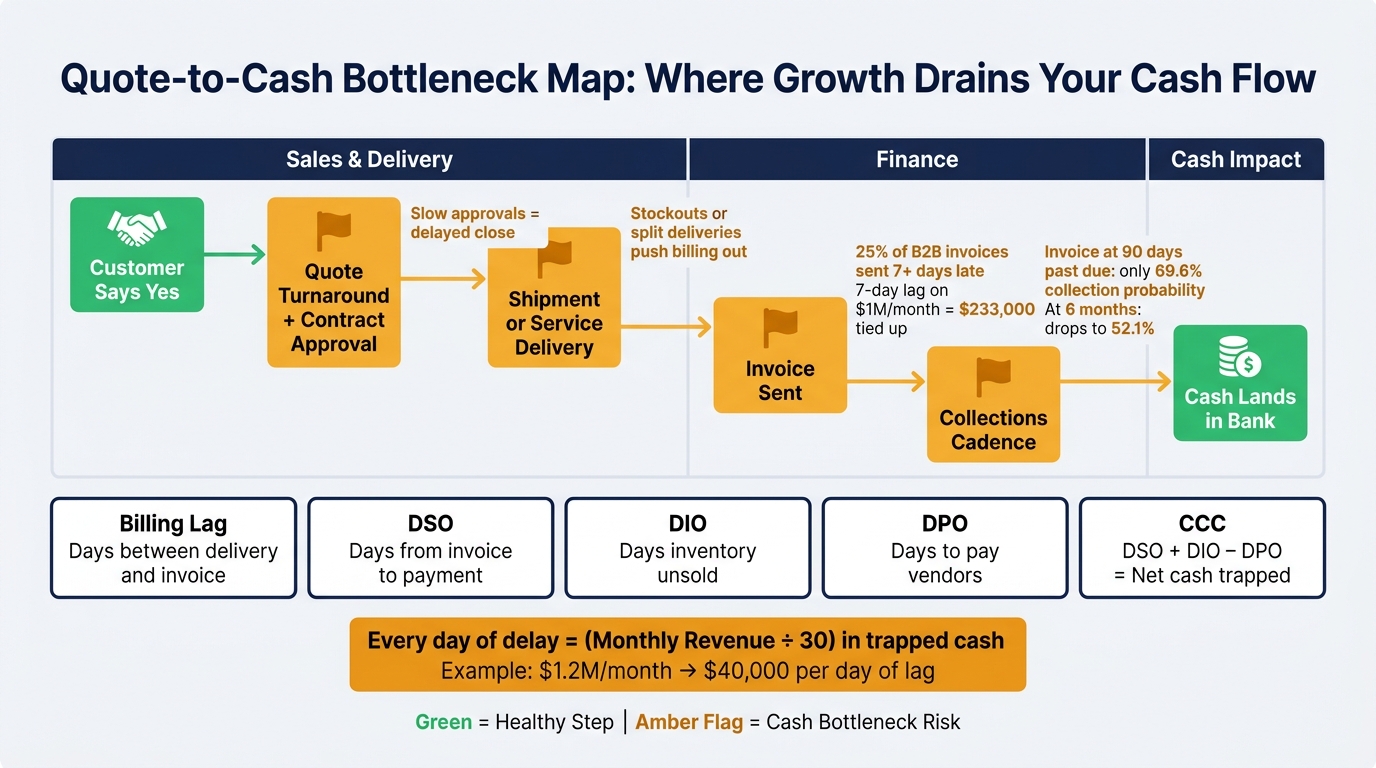
Quote-to-Cash Bottleneck Map: Where Growth Drains Your Cash Flow
Once you know where delays are hiding, the next move is simple: map one workflow from start to finish and measure where cash gets stuck.
Start with your highest-volume workflow. In most cases, that’s quote-to-cash or order-to-cash. Follow it from the moment the customer commits all the way to the bank deposit.
As you map it, note each:
Use transaction data, not guesses. And make a clear distinction between when revenue is booked and when cash actually lands in the bank. That gap is where a lot of trouble hides.
A simple swimlane diagram is usually enough. Keep sales, delivery, finance, and staffing visible at each step so the map lines up with the bottlenecks you already found.
The table below shows the metrics that expose cash delays.
| Metric | What It Measures | Cash Impact |
|---|---|---|
| Quote-to-cash days | Total days from customer commitment to cash receipt | Longer cycles mean more working capital tied up as revenue grows |
| Order cycle time | Days from order entry to delivery or fulfillment | Slow fulfillment pushes out the earliest possible invoice date |
| Billing lag | Days between delivery or fulfillment and invoice date | A 7-day lag on $1,000,000/month in revenue ties up about $233,000 in cash [4] |
| DSO | Days from invoice to payment | High DSO traps cash in accounts receivable |
| DIO | Days inventory remains unsold | High DIO means cash is locked in stock, not the bank |
| DPO | Days between invoice and payment | Lower DPO means cash leaves earlier than necessary |
| Cash Conversion Cycle (CCC) | Net days cash is tied up | Combines DSO, DIO, and DPO into one measure of cash cycle efficiency |
| Error rate | % of invoices requiring correction | Disputed invoices pause payment and extend DSO directly |
Use CCC to compare before-and-after changes in the same workflow. If CCC drops, less cash is getting trapped in the cycle.
Here’s the quick math. Take average monthly revenue and divide by 30. That gives you average daily revenue. Then multiply that number by the days of delay.
At $1,200,000 per month, average daily revenue is $40,000. So a 5-day billing lag ties up $200,000 in cash that has already been earned but not yet invoiced. Push that lag to 10 days, and it jumps to $400,000. And yes, that happens month after month [4].
The same logic applies to inventory and payables. If inventory is $250,000 above demand and safety stock, that cash is just sitting on shelves. If you pay vendors 20 days early on $600,000 in monthly purchases, cash leaves the business before it has to [5].
Rank the two or three delays that trap the most cash. Those are your first targets. The next step is fixing the bottleneck that causes them.
Use your ranking to fix one bottleneck first. Pick the constraint with the biggest cash effect that you can fix within 30 to 60 days using the team and tools you already have.
A simple scoring method works well. Score each bottleneck from 1 to 5 on three factors:
The highest total becomes your first target. In many cases, that means billing lag, a slow approval step, or a weak collections cadence. Those issues push out DSO and put more strain on working capital. Go after the delay that ties up the most cash first.
Change only what is blocking cash. Small, targeted fixes are usually faster to put in place and much less likely to throw day-to-day work off track than a full process redesign.
On the systems side, set up your ERP or billing tools to send invoices automatically as soon as work is done. If your CRM and billing system don't talk to each other, that's a problem. A signed deal or closed order should kick off an invoicing workflow right away, not sit in someone's inbox waiting for manual re-entry.
Policy changes can do a lot of the heavy lifting, and they often move faster. Replace ad hoc approvals with clear authority limits. For example, orders under $25,000 can auto-approve, while anything above that needs only one approver. For collections, stop relying on last-minute follow-up. Use a set cadence instead:
On the staffing side, shift ownership before you add headcount. Give one person clear responsibility for billing and collections. Cross-train backups for busy periods. Then block time each day - say, 9:00 to 11:00 a.m. - for invoicing and collections outreach so those tasks don't get buried under meetings.
The goal is faster cash conversion, not a giant process reset.
Track the fix every week so the bottleneck doesn't creep back in. A monthly review is often too late when cash is tight.
A focused weekly review of 30 to 45 minutes should look at four things: cash on hand, receivables aging, billing lag, and bottleneck backlog and cycle time. Compare each number with the prior week and with the improvement target you set when you first identified the constraint. If the numbers are heading the right way, stay the course. If they start to slip, make changes before the pressure builds again.
Revenue growth does not mean cash growth. It only helps cash flow when collections keep up.
According to QuickBooks' 2025 U.S. Small Business Late Payments Report, 56% of U.S. small businesses were owed money on unpaid invoices, averaging $17,500 each.[6] That’s a big drag on cash. And the problem usually goes beyond late-paying customers. In many cases, the slowdown starts inside the business itself - in sales, delivery, finance, and staffing.
After you map the leak, fix it in a clear order:
Then stick with the fix. Check DSO, invoice aging, cash on hand, and rolling forecasts every week. That way, issues show up early, before they turn into a cash crunch.
If you need help building that system, Phoenix Strategy Group helps growth-stage companies tighten finance processes, build cash forecasts, and connect operating metrics to cash outcomes.
Rapid growth can put real pressure on cash, because revenue growth and cash flow are not the same thing.
Here’s the issue: companies often spend money before they collect the revenue tied to that growth. That can mean paying upfront for new hires, software, inventory, and marketing while customer payments are still weeks away.
So a timing gap shows up. Cash leaves the business now, while payments may not come in for 30 to 90 days. If receivables, inventory, and payables aren’t watched closely, a company can look profitable on paper and still run into a cash crunch.
Map your accounts payable, accounts receivable, and inventory processes to spot where cash is getting stuck. Start with the area that shows the biggest gap. In most cases, fixing the highest-impact issue first leads to faster results and helps you build momentum.
For many growth-stage businesses, that usually means accounts receivable or inventory management. Try automation in one area first, measure the results over 60 to 90 days, and then expand once you see it working.
Quantify delays with your Cash Conversion Cycle (CCC): DSO + DIO − DPO. That gives you a clear view of how long cash is tied up in the business.
Next, map your workflows to spot where cash stalls. Common trouble spots include invoicing gaps and slow approval chains. Every extra day matters because that money isn't there for payroll or reinvestment.
Then put a dollar figure on the delay. Multiply your average daily revenue by the number of days saved. It’s a simple way to see what faster cash movement is worth.
Keep a close eye on DSO and DIO, automate invoicing and payment reminders, and use a rolling 13-week cash flow forecast to see how delays ripple through liquidity.