Published on
August 13, 2026


LTV does not help your runway until I map it to cash by month. A customer may look great on paper with a 3.0x to 5.0x LTV:CAC, but if CAC is paid now and cash comes in over 12 to 24 months, the business can still run short on cash.
Here’s the short version:
That shift matters because revenue, billings, and cash are different things. A self-serve cohort may pay back in 3 to 5 months. An enterprise cohort may take 18 months or more. Same SaaS model, very different cash picture.
A few numbers make the point fast:
If I want a forecast that helps with runway, hiring, and funding timing, I can’t stop at LTV. I need a monthly cohort cash view that shows:
In plain English: LTV tells me total customer value. Cash flow tells me when that value shows up. This article explains how to connect the two in one SaaS forecast.
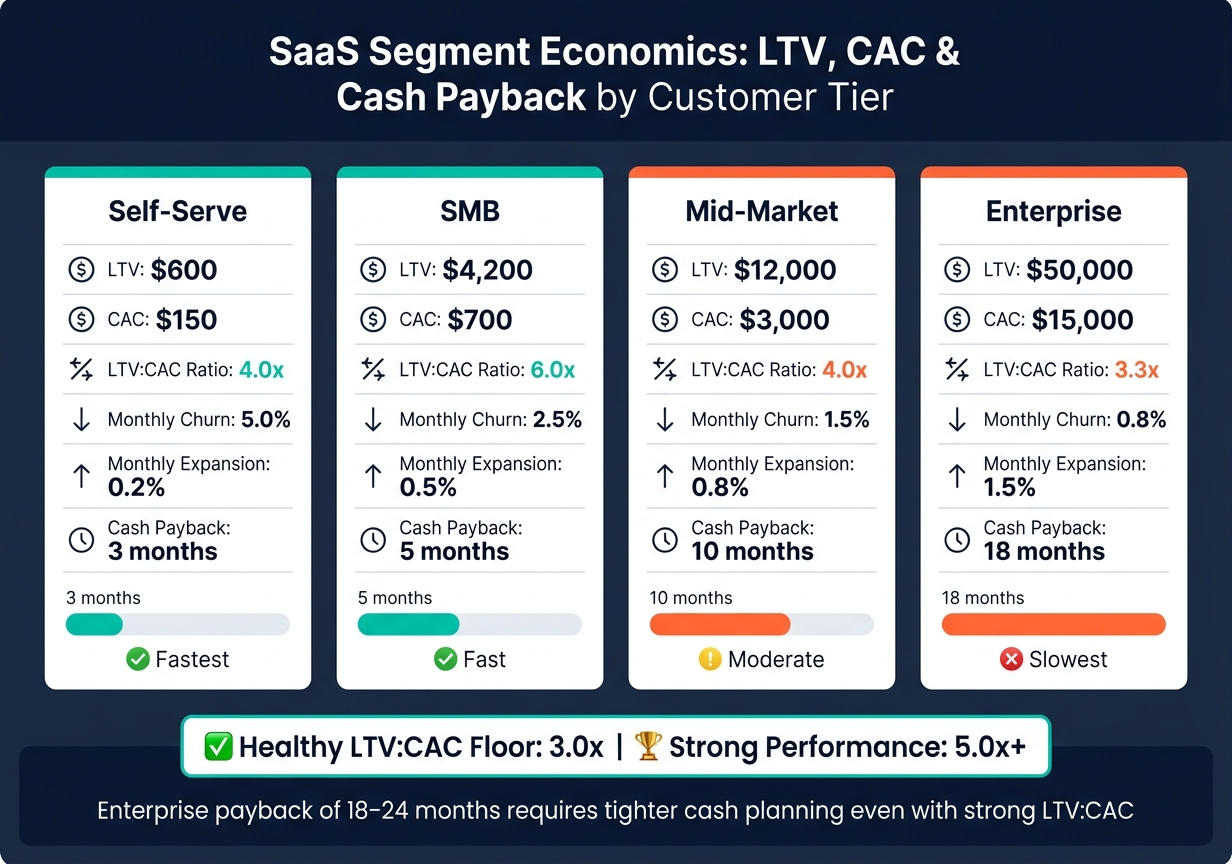
SaaS Segment Economics: LTV, CAC & Cash Payback by Customer Tier
Blended LTV and CAC averages can blur what's actually happening. One company-wide LTV figure might lump together a self-serve group that churns fast and an enterprise group that grows month after month. If you want a clear view - and you want to tie that view to cash timing - you need unit economics by acquisition cohort and customer segment.
Start by assigning each customer to:
Then build a matrix with rows for months since signup and columns for acquisition cohorts. In each cohort-month cell, track active customers, churn, expansion, and ending MRR.
Next, use cohort gross profit and churn patterns to sharpen LTV by segment. Begin with 3–4 cohorts and 12 months of history for each one, then look for the cohorts that retain better and the ones that cost more to acquire.[3][10]
This is where forecasting starts to get useful. Segmenting cohorts this way helps you map not just future revenue, but when cash is likely to come in and when it goes out. LTV and CAC at the cohort level shape both.
Once you have LTV by segment, calculate CAC by assigning acquisition costs to the segment that brought in those customers. That includes marketing spend, sales compensation, tools, and onboarding.
Segment CAC per customer = Total Segment Acquisition Cost ÷ New Customers in Segment.
For example, if you spend $150,000 to acquire 300 new SMB customers, CAC is $500. If you spend $300,000 to acquire 50 mid-market customers, CAC is $6,000.[3][9]
From there, add up monthly gross profit per customer until it matches CAC. That's your payback period.
If SMB CAC is $700 and monthly gross profit per customer is $140, payback lands in 5 months. If enterprise CAC is $15,000 and monthly gross profit is $1,000, payback takes 15 months. So even with strong LTV, cash can still get tight when CAC hits upfront and collections come later. In plain English: you spend first, then wait for revenue to catch up, which can squeeze runway.[7][11]
Example segment economics:[8][12][13]
| Segment | LTV (USD) | CAC (USD) | LTV:CAC | Monthly Churn % | Monthly Expansion % | Payback Period (months) |
|---|---|---|---|---|---|---|
| Self-serve | $600 | $150 | 4.0x | 5.0% | 0.2% | 3 |
| SMB | $4,200 | $700 | 6.0x | 2.5% | 0.5% | 5 |
| Mid-market | $12,000 | $3,000 | 4.0x | 1.5% | 0.8% | 10 |
| Enterprise | $50,000 | $15,000 | 3.3x | 0.8% | 1.5% | 18 |
As a rule of thumb, use 3.0x LTV:CAC as the floor and 5.0x as strong performance.[4][5][6] Self-serve and SMB tend to return cash faster, while enterprise needs tighter cash planning because payback often falls in the 12–24 month range.[1]
Use these segment LTV and CAC outputs to forecast cohort revenue in Step 2.
Use segment-level LTV and CAC to build revenue from the cohort level, not from one blended growth rate. Start with acquisition inputs for each segment, then turn those into monthly MRR.
Use one acquisition driver for each segment. For self-serve, that might be paid spend or PLG signups. For enterprise, it might be pipeline or sales capacity. Each segment also has its own sales cycle, so the timing is different. That means every segment needs its own acquisition timing and MRR ramp assumptions based on when the cohort was acquired, not just how many customers came in.
Model monthly MRR like this:
Ending MRR = Starting MRR + New MRR + Expansion MRR − Churned MRR − Contraction MRR[14][15][17]
Once you’ve set starting MRR, apply retention and expansion month by month.
This is where segment differences start to show up in plain sight. Higher-LTV segments tend to back-load revenue. They stay longer and often spend more over time. So an enterprise cohort signed in January may look small at the start, then produce much more MRR later through seat growth and add-ons. A self-serve cohort from that same month can do the opposite: peak early, then fade fast. Billing terms then decide when that revenue can actually churn or renew.
Contract length changes when revenue risk shows up in cash flow. Monthly subscribers can churn in any month, so revenue loss moves through the model on a steady basis. Annual contract customers can look retained right up until renewal, and then churn - or expansion - lands all at once. That creates renewal cliffs a blended churn rate hides completely.[16]
For annual contracts, track three things for each cohort:
At the renewal decision point, apply renewal probabilities instead of a simple renew-or-churn rule. For example, at annual renewal, 70% of customers may renew unchanged, 15% may expand, 10% may downgrade, and 5% may churn.[2] That timing matters even more when you separate logo churn from revenue churn.
Split churn into logo churn and revenue churn. Logo churn measures customers lost. Revenue churn measures MRR lost from downgrades and cancellations. Annual subscribers typically churn at about one-third the rate of monthly subscribers, so they should be modeled separately.
Start with the cohort revenue output from Step 2, then convert it into a monthly cash timing view.
That matters because revenue, billings, and cash are not the same thing. Billings are invoices sent. Revenue is recognized under ASC 606 over the service period. Cash receipts are the dollars that actually land in your account. If you want to see liquidity clearly, model monthly cash receipts separately from revenue.
CAC leaves your bank account before any revenue shows up. So don’t bunch it into one vague bucket. Split CAC into the cash items that drive it:
Then place each item in the month it’s paid. Paid media goes in the month campaigns run. Commissions usually hit on the next payroll cycle after close. Software tools show up as recurring monthly charges.[24][25][26]
This sounds simple, but it changes the picture fast. A cohort can look fine on paper while still putting pressure on cash in the near term.
Two cohorts can have the same ARR and still produce very different cash flow.
Why? Billing terms. A monthly self-serve or SMB customer often pays within days. Annual prepay can bring cash in during month 1. Enterprise deals are a different story. They may not collect for 30–90+ days after invoicing.[27][28][29][30][31][32]
That’s why each segment needs its own collection profile. For enterprise, a simple curve works well, such as 70% collected within 30 days, 25% within 60 days, and 5% delayed or written off.[27][28][29][30][31][32]
Those assumptions then feed the cohort waterfall.
The cohort cash waterfall tracks CAC outflows, cash collections, gross margin contribution, net cash, and cumulative cash by month. Apply gross margin to collected revenue, not just booked revenue, because hosting, support, and payment processing eat into the cash available to recover acquisition spend.[24][25][26]
The cash payback month is the month when cumulative net cash crosses zero. Here’s how that looks for a single cohort acquired in January 2026:[24][25][26]
| Month | CAC Cash Outflows | Cash Collections | Gross Margin % | Gross Margin Cash | Net Cash | Cumulative Cash |
|---|---|---|---|---|---|---|
| Jan 2026 | $(120,000) | $40,000 | 80% | $32,000 | $(88,000) | $(88,000) |
| Feb 2026 | $(30,000) | $60,000 | 80% | $48,000 | $18,000 | $(70,000) |
| Mar 2026 | $0 | $75,000 | 80% | $60,000 | $60,000 | $(10,000) |
| Apr 2026 | $0 | $80,000 | 80% | $64,000 | $64,000 | $54,000 |
In this case, the cohort hits cash payback in April 2026 - four months after acquisition.[24][25][26]
Payback targets differ by segment. SMB should aim for under 12 months. Mid-market often lands in the 12–18 month range. Enterprise at 18–24 months is common, but it can weigh on liquidity for a long time.[18][20][22][23]
And here’s the part teams sometimes miss: a healthy LTV:CAC ratio of 3× can still create cash strain if payback goes past 18 months. The math may look fine in the long run, but cash is tied up in acquisition spend and receivables for too long.[19][21][22]
Run this waterfall by cohort and by segment. That’s how you spot which groups are helping fund growth and which ones are burning runway. Those cohort cash outputs then roll up into the company-wide forecast in Step 4.
Once you've turned cohorts into cash waterfalls, the next step is to pull everything into one forecast. That's the only way to pressure-test runway, growth tradeoffs, and the right timing for a fundraise.
Use a three-tab model: Drivers, Revenue & Cohorts, and Cash Flow & Runway. This setup keeps segment timing out in the open instead of smoothing it over.
The Driver tab should be the only place where you enter inputs. Put all segment assumptions here, including LTV, CAC, churn, renewal rates, billing mix, and collections terms. When you change a driver, the rest of the model should update on its own.
The Revenue & Cohorts tab turns those assumptions into monthly cohort revenue and ARR. The Cash Flow tab then maps billings, collections, and CAC timing into monthly cash movement in USD.
Keep the model moving in one direction: drivers feed cohorts, cohorts feed revenue, and revenue feeds cash.
Run three scenarios: Base, High Growth, and Efficiency Focus. Each one should use different assumptions for churn, CAC, billing mix, and sales pace. The point isn't just to see changes in ARR. What matters is how those changes shift cash timing, runway, and the fundraise date.
A High Growth scenario might produce higher ARR by 12/31/2027 but force you to raise money sooner. An Efficiency Focus scenario might show lower ARR, but it can stretch runway and give you more leverage in fundraising talks. Use the standard formula: Runway (months) = Current Cash ÷ Net Burn. Here, net burn should come from actual cash collections shown on the cash flow tab. Even one change, like moving a segment from monthly to annual billing, can extend runway fast without changing a growth assumption.
If your model covers multiple segments, billing terms, and collection curves, Phoenix Strategy Group can help build and maintain an integrated forecast tied to CRM and billing data.
Once you build the cohort waterfall, the main point becomes clear: a standalone LTV number tells you the total value of a customer, but it does not tell you when that cash shows up.
LTV becomes useful for cash planning only when you connect it to cohort timing, CAC timing, renewals, and collections by segment. That’s the part many teams miss. A cohort can post a strong LTV:CAC ratio and still put pressure on cash if payback takes too long and customers pay on Net 30 terms.
Build the model in this order:
The practical goal is simple: shorten the month when cumulative cash pays back CAC. High LTV won’t save you from a cash crunch on its own. What helps is knowing exactly when each cohort’s cumulative collections cover CAC, then making sure enough cohorts hit that point before your cash balance drops to a runway floor.
Faster collections, annual billing, and tighter collection terms all speed up that crossover without changing LTV itself.
If your model spans multiple segments and collection curves, Phoenix Strategy Group can help build an integrated forecast tied to monthly cash flow.
Cash payback shows how long it takes to earn back fully loaded CAC in cash terms, usually measured in months. Put simply, it tracks the point when a customer’s gross profit has paid back what you spent to acquire them.
LTV:CAC is different. It’s an efficiency ratio that compares a customer’s total lifetime value to CAC, no matter when that cash comes in.
In Phoenix’s linked cash-flow approach, LTV helps shape cohort value and revenue timing. Cash payback focuses on something more immediate: how fast the business gets its cash back.
To build a cohort-based cash forecast, pull transaction-level data from your billing, CRM, product, and support systems into one source of truth.
You’ll need a few core inputs:
It also helps to bring in segment details like acquisition channel, pricing tier, and plan type.
On top of that, include DSO, payment terms, and past collection patterns. Then layer in behavior signals such as login frequency, feature adoption, and support interactions.
That mix matters because cash flow doesn’t come from billing data alone. A customer may look fine on paper, but shifts in product use or support activity can hint at what happens next.
Segments with high churn can put pressure on cash fast. This often shows up first with small business customers who leave soon after onboarding. They don’t have the staying power of enterprise accounts, so revenue can dip in ways that are hard to predict.
Blended averages can blur what’s going on. If newer cohorts have lower lifetime value or weaker retention than older ones, that’s often an early warning sign of cash strain - even before it shows up in top-line results.