Published on
August 8, 2026


If you own an industrial business in 2026, the short answer is this: most lower-middle-market deals land at 4x–7x EBITDA for add-ons and 7x–12x+ for platforms. But small companies often trade on SDE, not EBITDA, and the final price usually moves up or down based on size, recurring revenue, customer mix, and how dependent the business is on the owner.
Here’s the plain-English takeaway:
A few 2025–2026 shifts matter most. Higher rates and tighter lending kept pressure on weak deals. At the same time, data center cooling demand, HVAC service demand, and PE add-on activity supported better pricing for the right companies. The gap between average businesses and top-tier platforms got larger.
| Area | 2026 Range | What usually moves it |
|---|---|---|
| Micro industrial deals | 2.5x–4.0x SDE | Owner dependence, SBA financing, asset mix |
| Lower middle market | 4.0x–7.0x EBITDA | Margin stability, reporting, buyer fit |
| Regional platforms | 7.0x–10.0x EBITDA | Scale, management team, auction pressure |
| General manufacturing | 3.5x–7.0x EBITDA | Product mix, concentration, margins |
| Specialty/precision niches | 6.0x–12.0x EBITDA | Certifications, switching costs, end market |
| Industrial services | 4.0x–13.0x EBITDA | Contract mix, recurring revenue, mission-critical work |
My read: the market range matters, but business quality decides the outcome. If your books are clean, your customers are spread out, and the company can run without you, you have a better shot at the top end of the range.
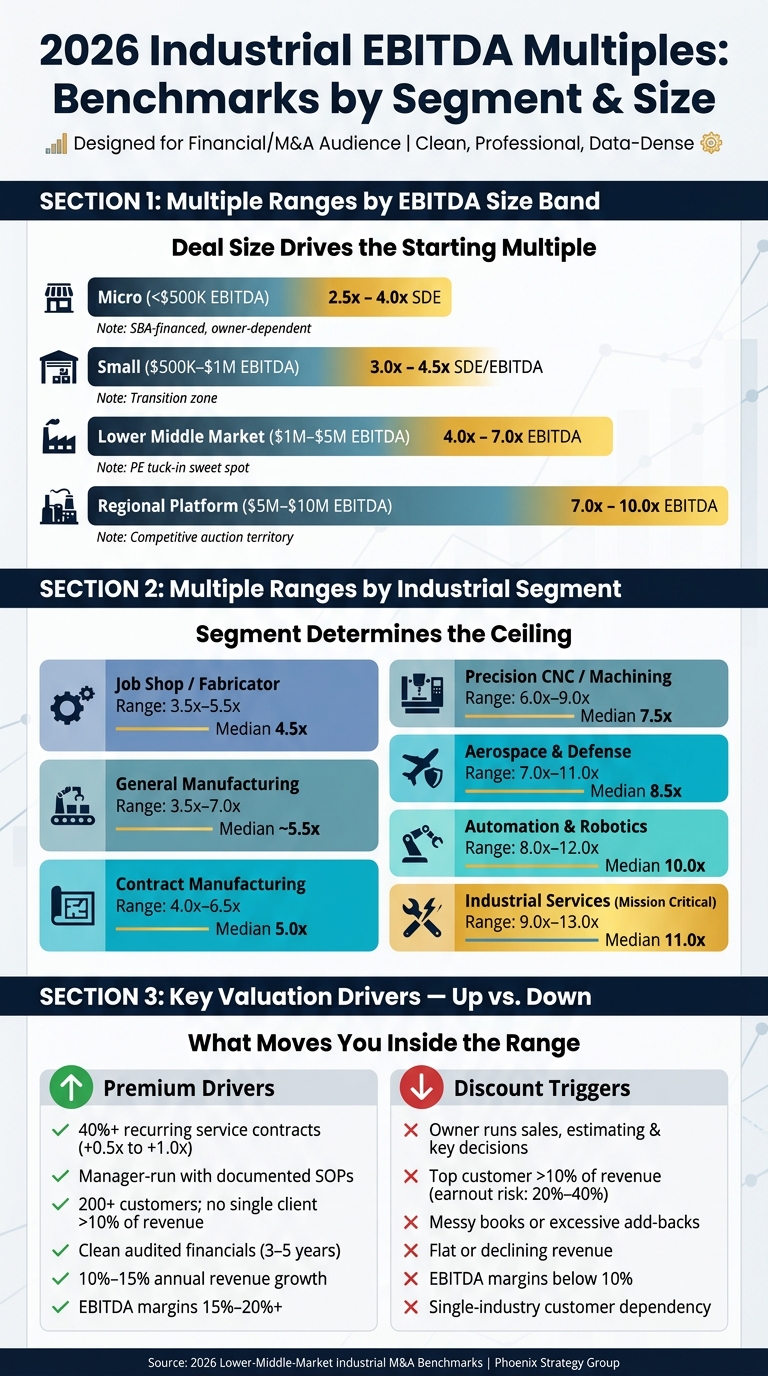
2026 Industrial EBITDA Multiples by Segment & Size
Industrial EBITDA multiples vary a lot by segment. In 2026, the gap is pretty clear once you look at the type of business, how sticky the customers are, and how hard the company is to replace.
Job shops, contract fabricators, light production operations, and contract manufacturers usually trade at 3.5x to 7.0x EBITDA. The top end tends to go to companies with proprietary products and less customer concentration [1]. In this part of the market, buyers usually focus on repeatability, concentration, and margin quality.
| Segment | Typical 2026 EBITDA Range | Median | Notes on Valuation Limits |
|---|---|---|---|
| Job Shop/Fabricator | 3.5x – 5.5x | 4.5x | Limited by high customer concentration and project-based revenue |
| Light Industrial Production | 4.5x – 7.0x | 5.5x | Higher end for businesses with proprietary products or low churn |
| Contract Manufacturing | 4.0x – 6.5x | 5.0x | Multiples compressed if reliant on a single industry (e.g., automotive) |
As these businesses get more specialized, multiples usually move up. Better margins, harder-to-win certifications, and higher switching costs all help.
Specialty niches trade at higher levels. Precision CNC and machining businesses trade at 6.0x–9.0x, with a median around 7.5x. That premium usually comes from aerospace or medical certifications and the pain customers face if they try to switch suppliers. Automation and robotics manufacturers trade at 8.0x–12.0x because of proprietary integration IP and long-run demand. Aerospace and defense suppliers trade at 7.0x–11.0x, backed by long-term contracts and strict MIL-SPEC traceability requirements. Specialized machinery trades at 6.5x–9.5x, helped by higher EBITDA margins and recurring parts and service revenue [1].
For owners, most of the spread usually comes down to a few things: certifications, compliance, and customer concentration.
| Niche | Typical 2026 EBITDA Range | Median | Main Premium Drivers |
|---|---|---|---|
| Precision CNC / Machining | 6.0x – 9.0x | 7.5x | Aerospace/medical certifications and high switching costs |
| Automation & Robotics | 8.0x – 12.0x | 10.0x | High growth demand; proprietary software or integration IP |
| Aerospace & Defense | 7.0x – 11.0x | 8.5x | Long-term contracts and strict MIL-SPEC traceability |
| Specialized Machinery | 6.5x – 9.5x | 8.0x | High EBITDA margins (avg. 19.6%) and recurring parts/service revenue |
Service businesses are priced a bit differently. Buyers care less about production mix and more about recurring contracts, customer stickiness, and whether the work is mission-critical.
Industrial services show the widest spread. Residential HVAC and plumbing tuck-ins trade at 4.0x–8.0x EBITDA, while commercial mechanical platforms tied to mission-critical infrastructure - like data centers, healthcare, and hyperscale technology - can reach 7.0x–11.0x [3]. HVAC businesses with 40%+ of revenue from maintenance agreements trade higher than install-heavy models [4]. Put simply, recurring contracts matter more than one-time install revenue.
Data center cooling demand is one of the biggest 2025–2026 drivers. Capstone Partners noted:
"Data center construction has emerged as a major commercial cooling driver... a key catalyst for 2025-2026 HVAC M&A momentum." [3]
Logistics-related businesses sit in their own band. Here, density, route control, and contract visibility tend to matter more than factory economics. For smaller owner-led companies, these ranges can tighten fast when customer concentration is high or revenue is project-based.
| Business Type | Typical 2026 EBITDA Range | Median | Common Buyer Profile |
|---|---|---|---|
| Residential HVAC / Plumbing | 4.0x – 8.0x | 6.0x | PE add-on platforms and local strategics |
| Commercial Mechanical | 7.0x – 11.0x | 9.0x | Large PE platforms |
| Industrial Services (Mission Critical) | 9.0x – 13.0x | 11.0x | Infrastructure funds and global integrators |
| Logistics / 3PL-Related | 5.0x – 8.5x | 6.5x | Strategic consolidators seeking geographic density |
Segment benchmarks set the outer range. But EBITDA size and buyer type usually decide where a business falls inside that range.
The first big pricing jump often shows up at about $1,000,000 of EBITDA. That’s the point where buyers stop thinking like owner-operators and start underwriting the deal on EBITDA. Then there’s usually another jump between $5,000,000 and $10,000,000 of EBITDA, when the company starts to look more like a regional platform than a simple tuck-in [2][3].
| EBITDA Band | Likely Revenue Profile | Typical 2026 Multiple Range | Deal Structure Notes |
|---|---|---|---|
| <$500K (Micro) | $500K – $2.5M | 2.5x – 4.0x SDE | Often SBA-financed; high owner dependency; asset-heavy [4][2] |
| $500K – $1M | $2.5M – $5M | 3.0x – 4.5x SDE/EBITDA | Transition zone; buyers look for businesses that can run without the owner [4] |
| $1M – $5M (LMM) | $5M – $25M | 4.0x – 7.0x EBITDA | PE tuck-in sweet spot; requires clean books and stable margins [2][3] |
| $5M – $10M (Regional) | $25M – $50M | 7.0x – 10.0x EBITDA | Competitive auction territory; requires multi-market presence [2][3] |
Put simply, size changes the lens buyers use. A sub-$500K EBITDA company is often judged like a job with risk attached. A $1M+ EBITDA company starts to get treated more like an asset that can run on systems, managers, and cash flow.
Size matters. But who is buying can matter just as much.
Strategic buyers and private equity firms look at industrial businesses in very different ways, and that can shift the multiple.
Strategic buyers are usually larger operators or industry consolidators. They can pay more when the deal gives them synergies they can use right away: shared back-office costs, better plant or route use, or direct access to customers they’d otherwise need time and money to win. That kind of fit can support a 0.5x to 1.5x premium [5]. On the flip side, strategics tend to back off when the deal brings too much duplicate overhead or when systems and culture don’t match up well.
Private equity buyers tend to be more numbers-first. They underwrite to a target return, usually 25%+ IRR, and lean on 3x–4x leverage, organic growth, and a later exit at a higher multiple [5][2]. In plain English: they often buy smaller companies at lower multiples, improve or combine them, then sell a bigger platform for more. A common pattern is buying at 3x–5x EBITDA and rolling those businesses into platforms that can later exit at 8x–15x+ EBITDA [4][2].
| Buyer Type | Where They Pay Up | Where They Discount | Likely Effect on Multiple |
|---|---|---|---|
| Strategic Buyer | Synergies, customer access, route/plant density, unique contracts [5][2] | Redundant overhead, incompatible tech stacks, poor cultural fit [2][3] | +0.5x to +1.5x premium for strong synergy fit [5] |
| Private Equity | Recurring revenue, scalable systems, strong middle management [2][4] | High owner dependency, customer concentration above 25%, aging equipment [2][4] | Market-rate multiple; typically requires 15%–25% rollover equity [3] |
One detail buyers watch closely is customer concentration. If a single customer makes up more than 10% of revenue, expect pressure on the multiple or an earnout that puts 20%–40% of consideration at risk [2].
Those buyer rules show up directly in the 2025–2026 market shifts below.
The ranges above are just the starting point. Where a business lands in 2025–2026 depends a lot on market conditions.
The big run-up in industrial multiples in 2021 didn’t stick. Higher interest rates and tighter lending pushed valuations down in 2023, and the market heading into 2026 looks more like a partial stabilization than a full comeback [4][3].
What changed most in 2025–2026 is the gap between weaker add-ons and top-tier platforms. For founders with $500,000 to $10 million in revenue, the main issue isn’t the average multiple. It’s figuring out which traits push a company to the top of the range.
A few macro trends are behind that split. The data center boom is driving demand for precision cooling and industrial equipment. At the same time, federal refrigerant transitions are forcing upgrade cycles for specialized service providers [4][3]. Buyers are paying more for companies that sit right in the path of those trends.
And in a tighter lending market, buyers are more careful. They lean toward businesses with recurring revenue, low customer concentration, and clean financials.
On the financing side, higher borrowing costs haven’t shut deals down. But they have made buyers pickier. SBA 7(a) loans are still a workable path for lower-middle-market deals, with acquisitions possible at as little as 10% down [4]. Bigger sponsors have kept chasing premium platforms by using longer-duration capital. PE add-on deals for industrial service providers rose 88% year-over-year through June 2025 [3].
Inside those valuation bands, four things tend to move pricing the fastest: recurring revenue, management depth, customer concentration, and reporting quality.
| Valuation Driver | Positive Signal | Negative Signal | Expected Effect on Multiple |
|---|---|---|---|
| Recurring revenue | 40%+ recurring service contracts | Primarily project-based or new construction | +0.5x to +1.0x |
| Management control | Manager-run with documented SOPs | Owner runs sales, estimating, and key decisions | Large premium or discount |
| Customer Concentration | 200+ customers; no single client >10% of revenue | Top 5 clients represent >25% of revenue | Risk discount or earnout exposure |
| Financial Reporting | Clean, audited 3–5 year history; minimal add-backs | Messy books; cash transactions; excessive add-backs | Buyer confidence and price certainty |
| Revenue Growth | 10%–15% annual trajectory | Flat or declining revenue | Growth premium |
| EBITDA Margins | 15%–20%+ | Below 10% | Efficiency premium |
For smaller companies, recurring service revenue is now one of the clearest ways to get to the top end of the range [4].
Owner dependence is the other big discount trigger. If a buyer thinks the company can’t run for two weeks without the owner, the business starts to look less like an asset and more like a job [4]. That’s why documented systems, delegated customer relationships, and a middle-management layer matter so much. They help protect the multiple.
Inflation has made things harder too. In 2024, steel and aluminum costs climbed 8%–12% because of tariff pressure [4]. Companies that passed those costs through to customers kept their 15%–20% EBITDA margins and stayed near the premium end of the range. Companies that ate the costs saw margin pressure, and their multiples moved down with it.
The same pattern shows up in diligence. Buyers don’t just look at EBITDA. They look at how much they trust it.
If monthly reporting is inconsistent, reconciliations are missing, or add-backs are large and discretionary, buyers see risk. And when buyers see risk, they price it in.
Clean, normalized financials help cut down on retrading and make it easier for buyers to underwrite the top of the range.
The big takeaway is simple: 2026 industrial EBITDA multiples are all over the map. Smaller industrial businesses usually sell at lower multiples. Larger platforms with better documentation tend to sell at higher ones. So the key issue isn’t just the market range. It’s which operating traits push a company toward the top end of that range.
For founders, the levers are pretty clear. The biggest discounts usually come from owner dependence, customer concentration, weak reporting, and limited recurring revenue. On the flip side, the fastest ways to move up the range are scale, diversification, recurring revenue, and finance-ready reporting. Clean books matter. They cut retrading risk and give buyers more confidence to underwrite the top end of the range. Keep no single customer above 10% of revenue, keep the top five below 25%, and reduce owner dependence.
Benchmarks set the range, but company-specific quality decides where you land. Use these ranges to see how much operating work is still left before a sale. Phoenix Strategy Group helps founders build the financial readiness that supports a stronger exit.
It depends on your company’s size and structure.
SDE is the standard for smaller, owner-operated businesses, often those under $1.5 million to $2 million in revenue. That’s because it reflects the owner’s total economic benefit, including pay and discretionary perks.
As a company grows and moves toward professional management, EBITDA usually becomes the better fit. Why? It swaps the owner’s salary for a market-rate management cost and gives investors a more standardized view of profitability.
Focus on lowering risk and showing room to grow. Buyers usually pay more for recurring revenue, a diversified customer base, a strong management team, clean GAAP-compliant financials, and efficient working capital.
It also helps to show growth that can scale, solid unit economics, clear retention and acquisition metrics, and strong positioning in a high-value sub-vertical, especially when backed by relevant industry certifications.
Buyer type can have a big effect on valuation because not every buyer looks at a business the same way. Some focus on price. Others care more about synergies, future growth, or what happens to the company after the deal closes.
That’s why sellers shouldn’t chase the highest bid on price alone. The better move is to look for the buyer type that fits the business model and the seller’s risk tolerance.