Published on
August 3, 2026


I’d renew an alliance based on seven numbers, not gut feel. The short list is: revenue share, pipeline yield, deal speed, gross margin, customer retention, partner effort, and forecast fit.
If I were reviewing a partner today, August 4, 2026, I’d start with the last 12 months, check quarter-to-quarter direction, and compare that partner against similar partners. That helps me answer one simple question: should I renew, reset terms, or end the alliance?
Here’s the article in plain English:
A few numbers stand out:
Use all seven KPIs together. A partner can look good on revenue and still fail on margin, retention, or planning.
Quick comparison
| KPI | What it tells me | Signal type | What I’d do with it |
|---|---|---|---|
| Revenue Share | Share of company revenue tied to the partner | Lagging | Check if the partner earns enough business to keep |
| Pipeline Yield | How much partner pipeline becomes revenue | Leading | Spot weak conversion before results slip |
| Deal Speed | Time to close partner deals | Mixed | See if the partner helps move deals or slows them down |
| Gross Margin | Profit left after payouts and support costs | Lagging | Test if the alliance still makes financial sense |
| Customer Retention | Whether partner-led customers stay | Mixed | Check customer quality after the sale |
| Partner Effort | Level of co-sell and delivery activity | Leading | See if the partner is building a real practice |
| Forecast Fit | How close actuals are to plan | Leading | Judge whether the partner can be counted on |
If I had to sum up the article in one line, it would be this: renew alliances that drive revenue, keep margin intact, hold customers, and hit plan - not alliances that just feel good to keep around.
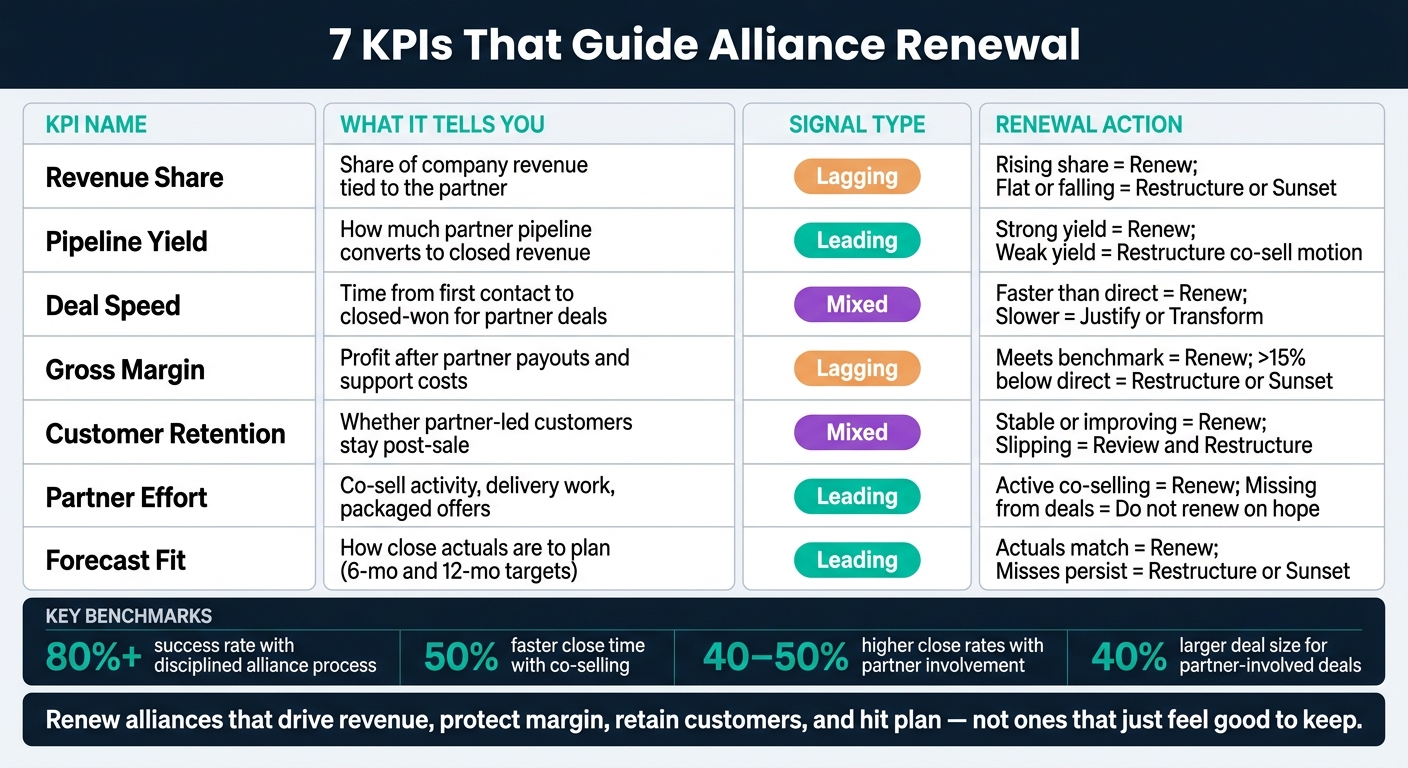
7 KPIs for Alliance Renewal: What Each Measures & When to Act
Renewing an alliance is a resource allocation call. You’re deciding whether to keep putting in time, budget, and executive attention - or send those resources somewhere else. So the point isn’t whether you like the partner. The point is whether the return earns another renewal. That frame keeps the seven KPIs below tied to the decision at hand, not instinct.
Review the partner across five dimensions: financial performance, sales execution, customer quality, operational effort, and planning accuracy. A partner can look strong on revenue and still be weak on margin. They can close deals fast and still bring in poor-fit customers. Looking at all five together helps you avoid blind spots.
Use a trailing 12-month view to smooth out seasonal swings and one-off wins. It gives you a better read on whether the partner is building a repeatable practice instead of just landing a few isolated deals.
"If your ecosystem, if your partners, are not making money around your solution, they're not going to build a practice around it, and they'll find another one that will." - Paul Bird, Magentrix [3]
Check whether the partner is profitable across more than one revenue stream, including services and unique IP, not just the margin they make on your product.
Use quarter-over-quarter trends to see if performance is getting better or starting to slip. Look at revenue contribution, pipeline yield, win rates, and deal velocity over time.
Research shows that effective co-selling can cut deal close time by 50% and improve close rates by 40% to 50% [3]. If those gains shrink from quarter to quarter, the partnership is losing strength.
Don’t compare a partner you launched six months ago with one that has had three years to ramp. Group partners by partner type, launch date, region, or maturity stage before you judge performance. Raw revenue totals don’t tell the whole story when cohorts have different ramp times or markets.
Cohorts help separate actual performance from ramp effects. If every partner launched in the same quarter is underperforming, the problem may be your onboarding process rather than the partners themselves. That changes how you think about renewal.
Use these filters to read the seven KPIs below in the right context.
Start with the most direct test of alliance value: how much revenue you can tie back to the partner.
Revenue share is the slice of company revenue that comes from the alliance. That includes partner-sourced deals and partner-influenced deals.
Partner-sourced deals are opportunities the partner created. Partner-influenced deals are deals that were already moving, but the partner helped push them forward.
Partner Revenue Share (%) = ((Partner-Sourced Revenue + Partner-Influenced Revenue) ÷ Total Company Revenue) × 100
"You're still going to measure what the net revenue generation is of your ecosystem." - Norma Watenpaugh, CEO and Founding Partner of Phoenix Consulting Group [3]
Revenue share is a lagging indicator. It tells you what already happened, not what’s likely to happen next. That’s why it works best when you pair it with pipeline yield and forecast fit.
A rising, durable revenue share is a good sign that the alliance is worth renewing. If that share stays flat or starts to slip, it’s a signal to renegotiate the partnership - or shut it down.
Pipeline yield shows whether partner-sourced pipeline turns into closed revenue. Think of it as the forward-looking match to revenue share.
Pipeline yield measures how much partner-generated pipeline becomes closed-won revenue. Put simply: of the pipeline your partners help create, how much actually crosses the finish line?
Pipeline Yield (%) = (Total Value of Closed-Won Deals ÷ Total Value of Pipeline) × 100
Higher-quality opportunities usually lead to higher yield. Pipeline volume on its own can look good on paper. Conversion is what tells you if the motion is working.
Pipeline yield is a leading indicator. It gives you a read on future performance before that revenue hits your books. Review it every quarter so you can spot early signs of conversion slippage.
It also helps to track partner involvement in solution design and late-stage deal support. When partners stay active in those parts of the deal, conversion often improves.
If yield looks strong but revenue still trails, the next thing to check is deal speed.
Healthy yield tends to show up through higher win rates and larger deals. Partner-involved deals can be 40% larger and close 50% faster [3].
"When you measure the impact of partner sales, of co-selling... companies... are finding: double the deal size 40%, acceleration 50%, higher close rates." - Norma Watenpaugh, CEO and Founding Partner, Phoenix Consulting Group [3]
Weak yield usually means the alliance is creating interest, but not enough closed business. If yield is low, look closely at deal speed and partner effort before renewing.
Strong yield is a clear renewal signal. Weak yield points to a need to restructure the co-sell motion.
Deal speed tracks how long a partner-sourced opportunity takes to go from first contact to closed-won. Put simply, it tells you whether the alliance is helping your team move deals through the pipeline with less drag.
Average Partner Sales Cycle (days) = Total Days to Close (All Partner Deals) ÷ Number of Closed Partner Deals
This number means more when you compare it against a few reference points:
Looking at deal speed in isolation can be misleading. The side-by-side comparison is what shows whether the partnership is helping or slowing things down.
Deal speed works best as an execution metric. Across a group of deals, it shows whether the partnership is moving opportunities through the process using the activities, tasks, and timelines set in the alliance plan [1].
That matters because partnerships often slow down when nobody is clear on who owns what. Clear, numeric goals for both partners and the customer can keep everyone pointed at the same target [2]. When the plan is loose, deal movement usually gets loose too.
There’s no single benchmark that works for every company. What matters is the comparison.
If partner-led deals take longer than direct sales, the alliance needs to justify the extra coordination [1]. If those deals move faster, that’s a strong sign the partnership is adding real value.
Founders should also check whether the team has a clear Team Charter and operating principles. Those can cut delays by spelling out roles, decision-making, and working styles [1]. In practice, this is often where things either click or fall apart.
If deal speed is improving, or if partner-led deals are staying faster than your direct motion, that supports renewal. If cycle times are getting longer, take a hard look at whether the alliance still has the strategic and operational fit to execute well. If it doesn’t, the partnership may need to be transformed at renewal [1].
Fast deal flow can look great on paper and still go sideways if partner costs eat up the margin. A partner might bring in revenue and still not be worth renewing if the unit economics don't hold up.
For partner deals, gross margin needs to include partner payouts and support costs - not just COGS.
Partner Gross Margin % = (Partner Revenue − COGS − partner rev-share payout − partner support costs) ÷ Partner Revenue × 100
This number gets more useful when you compare it against your direct sales margin and view it through a CAC-adjusted lens. A partner deal can still make sense even when gross margin is lower than direct sales, as long as the partner channel brings in a much lower Customer Acquisition Cost (CAC).
Gross margin is mostly a lagging sign of financial health. Still, a falling margin trend deserves early attention. In practice, it often points to price pressure or a partner that can't sell on value.
One issue shows up all the time: hidden internal support. Your team quietly starts doing work the partner was supposed to handle. That drives up COGS and chips away at margin. If margin is slipping and the reason isn't obvious, look closely at whether your support or implementation teams are filling the gap.
Use these thresholds as a screening tool for renewal, not the final call. Start a formal review if partner-sourced gross margin drops more than 15% below your direct sales margin, unless CAC drops enough to offset it. A minimum gross margin range of 50%–60% on partner deals is also a solid internal benchmark. If deals keep landing below that band, they need a closer look.
| Metric | Direct Sales Benchmark | Partner Renewal Trigger (Review) |
|---|---|---|
| Gross Margin % | 70%–85% | < 50% or > 15% variance from direct |
| Support Cost % of Revenue | 5%–10% | > 15% of partner revenue |
| Discounting Level | ~10% standard | > 2× direct sales average |
If margin meets or beats your benchmarks, that's a strong case to renew. If the partner brings in good volume but margins are tight, restructuring is often the better move. That can mean:
Low volume plus low margin, with no clear path to fix either one, points to sunset.
And if margin stays steady while customer churn goes up, the renewal case gets weaker.
After margin, the next thing to check is whether the alliance is bringing in customers who actually stick around. Retention shows whether partner-led customers stay after the sale, not just whether they sign in the first place.
Track retention against a launch baseline, then measure it against 6- and 12-month targets.
"For each metric establish a baseline 'where you are today' and a goal 'where you want to be in 6 mo, 1 yr.'" - Norma Watenpaugh, CEO and Founder, PhoenixCG [2]
Track retention across the full customer lifecycle, not only at renewal. That gives you an earlier read on whether the alliance is bringing in accounts with staying power or just short-term wins.
Use the launch baseline and the 6- and 12-month targets to judge whether the alliance has earned renewal. If retention is stable or getting better, that points to a partner that is producing durable accounts, not one-and-done deals.
If retention starts to slip, use that review point to decide whether to renew, restructure, or sunset the alliance. [1][2]
After revenue, pipeline, and speed, the next thing to check is effort: is the partner actually doing the work?
Partner effort looks at how much real selling, co-selling, and solution-building a partner puts in. Track things like co-selling activity, work with other partners, and packaged offers such as services, connectors, or accelerators.
Put simply, effort is the leading signal behind the numbers above.
Revenue is a lagging signal. Effort shows whether the partner is building a repeatable practice or just showing up now and then.
Look for proof that the partner is making money from services, IP, or productized offers tied to your solution. When partners earn around your solution, they usually have a stronger reason to stay active.
Co-selling is the clearest proof of effort. If the partner is missing from co-sell motions, renewal risk goes up.
If the partner appears in reports but not in actual deals, do not renew based on hope.
That same effort should also make your forecast more reliable, which is the next renewal test.
Measure forecast fit by comparing actual results to clear 6-month and 1-year targets. This tells you whether a partner can be trusted to plan, not just sell.
"The best [objectives] have very clear, numerically stated objectives for both partners and customer." - Norma Watenpaugh, CEO and Founding Partner, Phoenix Consulting Group [2]
Forecast fit is a leading indicator of future revenue. If it stays off, that can point to inaccurate pipeline projections, weak partner engagement, or weak unit economics. [3]
These misses often expose overlapping ownership or unclear swim lanes. In plain English, two people may think they own the same deal, or no one owns it in a clean way. That usually means the engagement model needs to be reworked. When forecast fit breaks, the issue is often process, not just performance.
| Forecast Fit Pattern | Recommended Action |
|---|---|
| Actuals match forecasts and 6- and 12-month goals | Renew - the forecast is consistent, and the partner is delivering against agreed goals |
| Forecasts miss because ownership overlaps or swim lanes are unclear | Restructure - redefine roles and tighten pipeline tracking |
| Forecasts stay weak because the partner cannot make money on your solution | Sunset - the partner is unlikely to invest further |
Use this as the last input to the renewal scorecard.
Once you have the seven KPI results, the next step is to turn them into a clear renewal call: renew, renew with conditions, or restructure.
Each category should reflect the overall balance of business and partnership risk, not just one KPI. [1] In other words, don't let one strong number hide a weak partnership. And if the partner needs a reset, the renewal period is the right time to update goals and operating rules.
| Renewal Category | Typical KPI Pattern |
|---|---|
| Renew | Most KPIs are on target or better, and the partner still fits |
| Renew with Conditions | Results are mixed, but the alliance can continue with specific fixes |
| Restructure | Performance or fit is weak enough that renewal should reset goals and operating rules |
Use these categories to help weight the scorecard, not as a substitute for it.
Revenue matters. But it shouldn't outweigh margin, customer retention, or forecast accuracy.
A partner can drive a strong share of revenue and still create risk if margins are thin, retention is weak, or forecasts keep missing the mark. That's where teams can get tripped up. The numbers may look good at first glance, but the working model underneath may not hold up in the next cycle.
When results are mixed, ask a better question: not just whether the partner brought in revenue, but whether the alliance is still set up to work well in the next period. That means weighing business risk and partnership risk together. [1]
A simple scorecard makes it easier to compare decisions across partners and review periods. Keep the scoring consistent, then add judgment about fit.
If the scorecard shows mixed results, use the renewal window to line up on operating principles and any joint operational changes needed for the next cycle. That could mean tighter forecasting rules, clearer ownership, or reset targets.
Use the scorecard output to populate the tables and dashboard below.
These templates help you turn KPI results into a renewal decision. Instead of looking at one number in isolation, you can line up all seven KPIs in one place, compare partner results against direct sales, and see what changed from one quarter to the next.
Start with the renewal scorecard. Score all seven KPIs together, not just revenue. And set your weights before you score, so the final call isn’t swayed by one strong or weak metric.
| Partner Name | Revenue Share | Pipeline Yield | Deal Speed | Gross Margin | Customer Retention | Partner Effort | Forecast Fit | Overall Score | Recommended Action |
|---|---|---|---|---|---|---|---|---|---|
| Partner A | |||||||||
| Partner B | |||||||||
| Partner C |
Partner Effort scale: 1–5. Score all KPIs before assigning the overall rating.
Next, compare partner performance with your direct-sales baseline. This gives you a cleaner read on impact. A partner might give up some margin, for example, but make up for it with bigger deals, better retention, or tighter forecasting.
| Metric | Partner-Sourced | Direct Sales | Variance/Impact |
|---|---|---|---|
| Avg. Deal Size | $140,000 | $100,000 | +40% |
| Win Rate | 38% | 25% | +13% |
| Sales Cycle | 45 days | 90 days | 50% faster |
| Gross Margin | 22% | 28% | −6% (due to share) |
| Retention Rate | 94% | 88% | +6% |
| Forecast Variance | ±5% | ±12% | ±5% |
Judge margin against retention, win rate, and forecast variance together.
Use this dashboard to track each KPI against its benchmark range and quarter-over-quarter movement. That way, you’re not just asking where the partner stands today. You’re also looking at direction. Are they improving, slipping, or holding steady?
| KPI | Benchmark Range | Q3 Performance | Q4 Performance | Q-o-Q Change |
|---|---|---|---|---|
| Revenue Share | 10%–25% | 18% | 20% | +2% |
| Pipeline Yield | 25%–40% | 30% | 32% | +2% |
| Deal Speed | < 60 days | 55 days | 48 days | −7 days (improved) |
| Gross Margin | > 20% | 21% | 22% | +1% |
| Customer Retention | > 90% | 92% | 91% | −1% |
| Partner Effort | 3+ co-sell deals/mo | 2.5 | 4.0 | +1.5 |
| Forecast Fit | > 85% accuracy | 80% | 88% | +8% |
Once the scorecard is built, the next test is data quality. A renewal review is only as strong as the data behind it. If your systems don’t talk to each other, the scorecard can get warped fast.
That’s where financial advisory support comes in. Phoenix Strategy Group helps growth-stage companies set up the FP&A, data, and unit economics systems needed for dependable alliance reviews. With cleaner reporting, founders can check partner performance throughout the year instead of waiting until renewal time.
When KPI data lives in separate tools, the renewal score gets noisy. Better FP&A processes and connected data pipelines help clean that up.
With stronger reporting, you can track all seven KPIs from one source and spot performance changes before they turn into renewal problems. Data engineering support that links your CRM, billing system, and financial model makes that work across the business.
That same data should also tell you whether the alliance makes enough money to renew. Integrated models show whether the partner relationship creates enough value to keep going.
Unit economics analysis helps you see whether a partner’s deals leave enough margin to cover the revenue share, co-sell investment, and onboarding costs. Pair that with rolling cash flow forecasts, and founders get a numbers-backed answer to the renewal question - not just a gut call.
After looking at these seven KPIs, the renewal decision gets a lot clearer: does this partner earn another cycle or not?
Alliance renewal shouldn't come down to instinct. It should come down to business results. Taken together, these KPIs show whether the alliance is growing revenue, lifting conversion, protecting margin, keeping customers, driving real partner effort, and lining up with forecast expectations.
No single KPI gives you the whole picture. But all seven together make it much easier to see whether a partner has earned another cycle.
Ecosystem metrics need to prove business impact, not just activity.
When revenue, margin, retention, effort, and forecast fit move in the same direction, renewal makes sense. When they don't, the alliance likely needs a reset. Use the full KPI set to renew, restructure, or exit with confidence.
Weight the seven KPIs around your business goals and the partner’s job in the relationship, whether that’s building pipeline or helping expand existing accounts. Put the most weight on the metrics that have the biggest effect on shared business results.
Use a mix of hard numbers and human judgment. Revenue share and deal speed show what’s happening on paper. Partner effort and forecast fit help you see what those numbers may not show right away. Revisit the weights during 30-, 60-, or 90-day check-ins as partner performance and market conditions shift.
Review the partnership’s financials to find the cause. Different business models often come with different margin expectations, so a low margin on its own doesn’t tell the whole story.
Use this formula to measure true profitability: (Total Partnership Revenue – Total Partnership Costs) / Total Partnership Revenue × 100. If margins fall below your set thresholds, start a formal review to decide whether to renegotiate terms or shift resources.
Use a tiered review cadence:
This rhythm helps you catch issues early, spot patterns over time, and keep both sides accountable.