Published on
August 8, 2026


If you underwrite a green building deal on first cost alone, you can miss where the money is made or lost.
I’d sum it up like this: lifecycle cost modeling helps me test when cash goes out, when savings show up, and how exit value changes the deal. In most cases, that means I need to look past upfront capex and build a timed model for ownership costs, replacements, tax items, and resale value.
Here’s the short version:
A few numbers matter right away. The article points to 30 years as a study period only when it fits the asset or policy case, not by default. It also shows how a 3-year hold leans far more on resale value, while a 15+ year hold picks up more utility and maintenance savings, plus avoided replacement costs.
If I had to reduce the whole framework to one rule, it would be this: model each cash flow in the year it happens, then test whether the deal still works after tax and under weaker exit assumptions.
That is the lens for the rest of the piece.
With the cash-flow logic in place, build the model around cost limits, replacement timing, and exit value.
Model three phases: acquisition, utilization, and disposal or exit proceeds.
Use a study period that matches the decision horizon. Use 30 years only when it fits the asset or policy case. [1]
If the hold period and asset life don’t match, add a hold-period model so exit value is captured the right way.
Once the study period is set, map each replacement to a specific year. Give every major system an expected service life and schedule replacements by year. [1]
| Component category | Typical items to schedule | Modeling note |
|---|---|---|
| Envelope | Roof membrane, insulation, stucco/gypsum walls, window ribbons | Schedule roof, insulation, and facade replacements by service life. |
| HVAC systems | VAV boxes, heat coils, chillers, gas furnaces, PTAC units | Map replacement years and efficiency decline. |
| Plumbing/water | Natural gas hot water tanks, pumps | Schedule tanks and pumps to avoid surprise NOI hits. |
| Electrical/lighting | Interior lighting fixtures, exterior lighting, elevators | Separate the upfront premium from operating savings. |
Keep initial development capex separate from in-hold recapex.
Next, separate who gets each savings stream.
Model owner cash flows apart from tenant savings. Only savings that affect rent, occupancy, or terminal value belong in the owner case.
Tenant savings matter only when they change rent, occupancy, or sale price. Count only the effects that flow into owner cash flow or terminal value.
Once the cost timeline is set, turn it into NPV, IRR, and scenario analysis.
Once you have the cash-flow schedule, turn it into decision metrics.
NPV does two different jobs in green building analysis.
The first is lifecycle cost NPV. This tells you which option has the lowest present value of total costs across the study period. Use it when you're comparing mutually exclusive choices that have different cost patterns over time.
The second is investment NPV. Use investment NPV to check whether the discounted cash flows are enough to justify the purchase or retrofit cost.
IRR shows the annualized return built into a set of cash flows. In practice, use incremental IRR on owner cash flows to test whether the added capital for a higher-performance design is worth the savings it generates. If the incremental IRR is above the hurdle rate, the upgrade passes the return test.
Simple payback can help show near-term cash pressure. But payback and discounted payback should not be used to rank long-term economic merit, because both stop counting at the recovery date.
The discount rate is what turns future costs and benefits into present value. For private deals, use a rate that reflects the opportunity cost of capital and lines up with the planned hold period and capital stack. Then test the discount rate, study period, and escalation assumptions to see if the result still stands.
Use that base case for the scenario analysis that follows.
Turn green features into year-by-year cash flow, not a rough guess.
That means tracking annual savings for energy, water, labor, maintenance, and repairs with an energy model, utility bill audit, or engineering study. A round-number estimate can make a deal look better than it is. Energy models help, but they aren't promises. They should be checked against actual utility data [1].
One point often gets missed: site energy and source energy are not the same thing. Site energy reflects what the utility bills. Source energy also includes generation and transmission losses [1]. If your model uses one basis and your underwriting assumes the other, the numbers can drift fast. Be clear about which one you're using.
After that, take the gross savings and convert them into after-tax cash flows before you test returns. That's the number that matters when you're looking at deal performance.
U.S. incentives can change the shape of returns in a big way, so they need to sit inside the model, not in a side note.
Apply tax credits, depreciation, and financing costs straight to after-tax cash flow. Federal items like the Investment Tax Credit and bonus depreciation affect both timing and dollar value, so model them at the transaction level. If you treat them like a footnote, you'll miss how they shift payback, IRR, and equity yield.
One base case doesn't tell you much. Real deals move around. Utility prices change. Construction costs run over. Exit pricing softens.
That's why scenario analysis matters. It shows whether the deal still holds up when inputs go the wrong way.
| Input Variable | Below Case | Base Case | Above Case | Decision Signal |
|---|---|---|---|---|
| Electricity price escalation | Lower than expected | Underwritten | Higher than expected | Does return stay above hurdle? |
| Capex overrun | Above budget | On budget | Below budget | Does NPV stay positive if costs run over? |
| Exit value | Weaker exit value | Underwritten | Stronger exit value | How much does exit value move equity return? |
If the deal only works in the base case and above case, you're probably understating risk. In that situation, find the assumption doing the heavy lifting.
Use the downside case to test whether the planned exit still clears the target return.
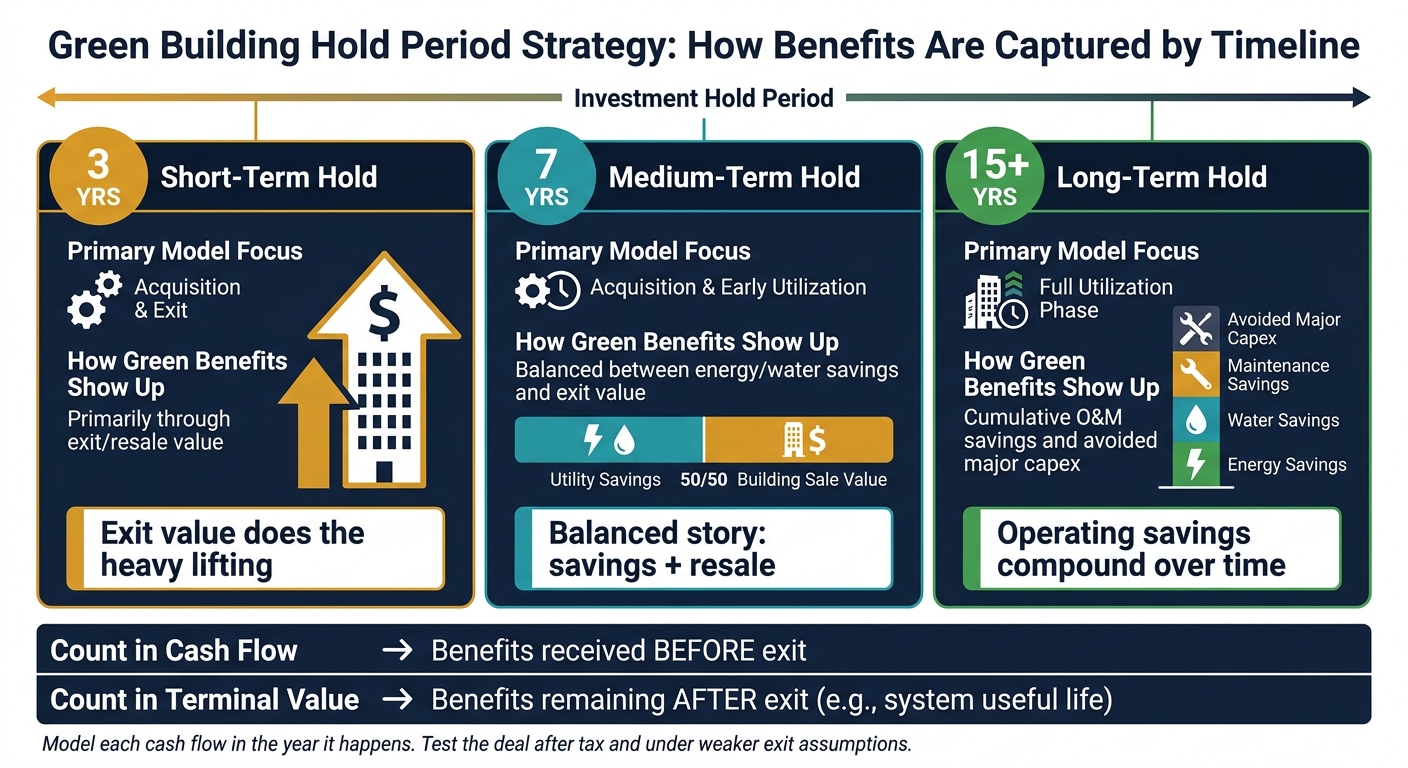
Green Building Hold Period Strategy: How Benefits Are Captured by Timeline
After you stress-test the cash flows, line them up with the period you expect to own the asset.
Use the cash-flow schedule to sort benefits by when the owner can actually collect them. Model the planned hold period, not the building’s full physical life.
That distinction matters more than people think. A 3-year owner and a 15-year owner may buy the same building, but they do not get paid back in the same way.
Short holds lean heavily on exit value. Medium holds split the story between operating savings and resale value. Long holds pick up most of the operating savings, plus the impact of replacement cycles.
| Hold Period | Primary Model Focus | How Green Benefits Show Up |
|---|---|---|
| Short-term (3 yrs) | Acquisition & Exit | Primarily through exit/resale value |
| Medium-term (7 yrs) | Acquisition & Early Utilization | Balanced between energy/water savings and exit value |
| Long-term (15+ yrs) | Full Utilization Phase | Through cumulative O&M savings and avoided major capex |
The big modeling mistake is simple: tying savings and replacement events to the wrong exit date.
Two issues do the most damage: leaving out replacement capex and skipping terminal value at exit.
| Weak Practice | Stronger Alternative |
|---|---|
| Omitting replacement capex | Schedule capex by component life and replacement year |
| Ignoring terminal value at exit | Include remaining useful life of systems in terminal value |
This is especially important for shorter holds. If a system still has years left when you sell, that remaining useful life can add terminal value for the next buyer.
A practical way to think about it:
That keeps the model tied to the actual deal, instead of a paper timeline that the owner never lives through.
Choose the hold period by projecting returns across several exit years and comparing projected IRRs to see which timing looks best.
It also helps to factor in the J-curve, lease-up speed, market cap rate moves, and interest rate changes. Then keep your financial model current with actual cash flows so you can make a clear call on whether to hold, sell, or reinvest.
Terminal value is the asset’s value after the hold period ends. In most cases, you estimate it by applying an exit cap rate to the last year’s projected NOI.
Then work backward from that sale price. Subtract the remaining mortgage balance and expected selling costs. What’s left is the terminal proceeds, which show up as the final cash inflow in the lifecycle model.
Model state and federal income taxes, property taxes, transfer taxes, and recording or mortgage charges so your after-tax cash flow and IRR reflect what you’ll actually keep.
For renewable energy or infrastructure deals, add ITC, PTC, bonus depreciation, and local costs like emission fines. Those items shouldn’t sit off to the side. Work them into cash-on-cash return and debt service coverage ratio calculations too.