Published on
August 24, 2026


If I ignore upsells, my LTV math can be off by 30% to 50%. That is the main point here.
This article shows a plain way to model LTV when customer revenue grows after signup. I start with the basic formula, then add expansion revenue, gross margin, revenue churn, and finally move to cohort data so the model matches what customers actually do.
Here’s the short version:
A simple example from the piece shows the gap clearly:
Without upsell, profit LTV is $5,000.
With upsell, profit LTV becomes $7,500.
That is a 50% jump, and it changes how I think about paid growth, segment targets, and sales efficiency.
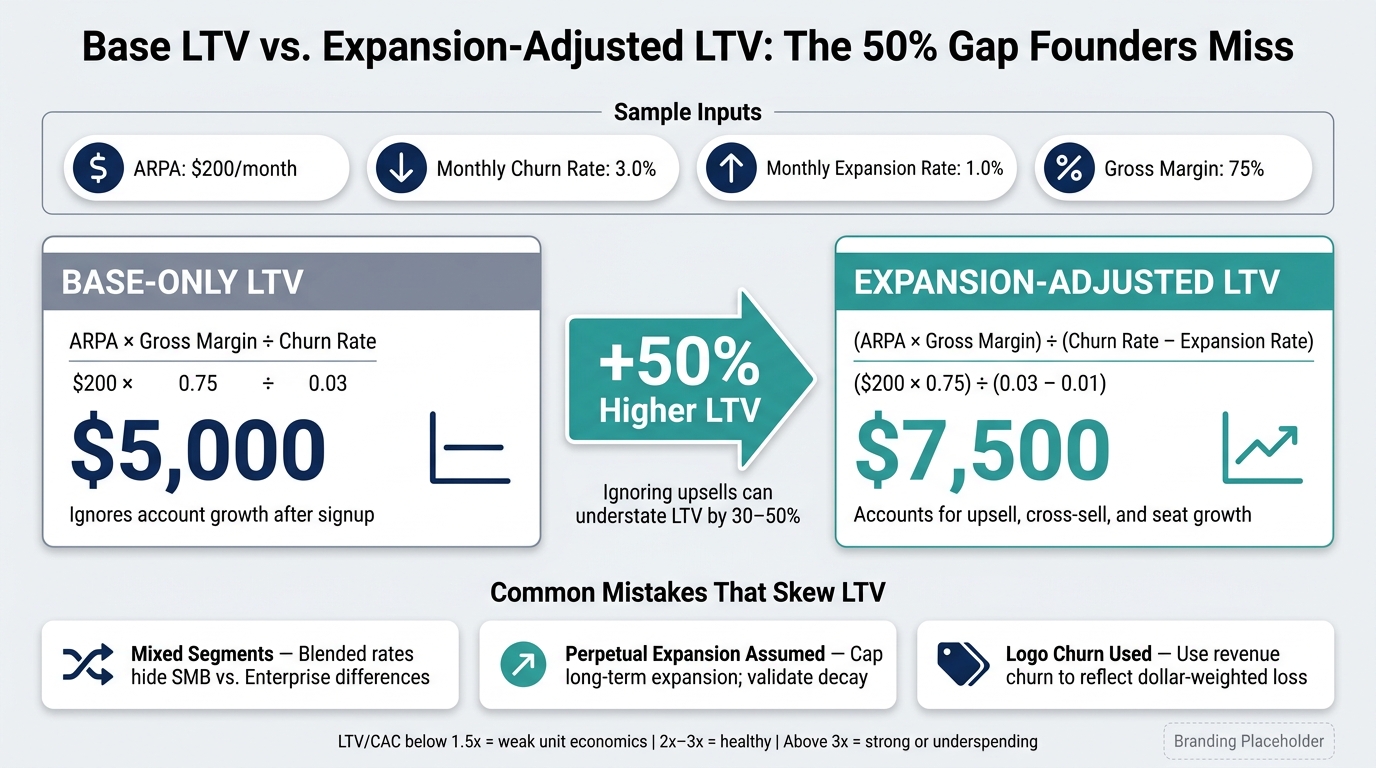
Base LTV vs. Expansion-Adjusted LTV: The 50% Gap Founders Miss
| Model | Formula | Using the sample inputs | What it misses |
|---|---|---|---|
| Base-only LTV | ARPA × gross margin ÷ churn | $5,000 | Ignores account growth after signup |
| Expansion-adjusted LTV | (ARPA × gross margin) ÷ (churn − expansion) | $7,500 | Breaks if expansion is higher than churn for long periods |
| Cohort LTV | Monthly cohort cash flow with churn, expansion, contraction, and margin | Varies by cohort | Takes more data and setup |
My takeaway: if customer spend grows over time, I should not stop at a flat-ARPA formula. I need a cohort model that treats upsell as its own line item and checks every assumption against observed cohort behavior.
Start with the simple version before you get into cohort data.
There are two baseline ways to estimate revenue LTV:
If the average account pays $200/month and stays for 36 months, revenue LTV is $7,200.
Using churn, the math looks like this: $200 ÷ 0.03 = $6,667.
To turn that into profit LTV, multiply revenue LTV by your gross margin %. Gross margin is revenue minus direct delivery costs like hosting, support, and payment processing. So if gross margin is 75%, profit LTV is:
$6,667 × 0.75 = $5,000
That $5,000 figure is the one you want for CAC and payback comparisons because it reflects gross profit, not just top-line revenue.
One more thing here: use revenue churn, not logo churn. Why? Because account size changes over time. Upsells can offset losses, and small accounts don't carry the same weight as large ones. A company can lose a lot of small customers and still keep most of its revenue. That's why revenue churn tells the better story.
Once you factor in expansion, the formula changes to:
Profit LTV = (ARPA × Gross Margin %) ÷ (Churn Rate − Expansion Rate)
Expansion rate measures MRR growth from upsells, cross-sells, add-ons, seat growth, and usage. The monthly version is:
Expansion rate = expansion MRR ÷ starting MRR
Using the article's working numbers - $200 ARPA, 3.0% monthly churn, 1.0% monthly expansion, and 75% gross margin - the math becomes:
($200 × 0.75) ÷ (0.03 − 0.01) = $150 ÷ 0.02 = $7,500
That puts profit LTV at $7,500, which is 50% higher than the base profit LTV of $5,000.
This shortcut is useful, but only up to a point. It works when churn and expansion are stable and when churn stays above expansion. If expansion moves above churn, the shortcut stops working. At that point, switch to a cohort cash-flow model.
You can also sanity-check your assumptions with NRR:
NRR = (Starting MRR + Expansion − Contraction − Churn) ÷ Starting MRR
An NRR above 100% means expansion is beating churn. That's a strong signal, but it still needs cohort data behind it if you want to trust it.
Next, turn these assumptions into cohort inputs so the model matches actual customer behavior.
Once the formula is set, the next step is feeding it clean monthly inputs. Pull monthly MRR into four buckets: new, expansion, contraction, and churn.
Use this identity: Ending MRR = Beginning MRR + New MRR + Expansion MRR − Contraction MRR − Churned MRR
That split matters. It keeps expansion revenue out of base MRR and puts it in the cohort model, where it should be.
Pull subscription, deal, and margin data from your billing, CRM, and accounting systems.
Then tag every subscription change event with a custom field, such as MRR_change_type, so your data warehouse can classify each delta on its own. Positive changes from current customers should be marked as expansion. Full drops to $0 should be marked as churn. This kind of tagging keeps upsell revenue out of base MRR figures and makes your LTV model more dependable.
Once your data is clean, group customers by acquisition month and segment. Each cohort row should include start month, segment, plan type, starting MRR, average CAC, gross margin %, plus monthly columns for expansion, contraction, churn, and ending MRR over time.
Blended averages can hide what’s going on underneath. Say your total expansion rate is 5% per month. That can sound fine at first glance. But that same number might hide enterprise cohorts growing at 10% while SMB cohorts sit at 2%.
And that gap matters. If you use the blended 5% to justify a high CAC for SMB deals, you’ll keep overpaying for customers whose actual LTV doesn’t support it.
Cohort-level tracking by start month and segment shows you where upsell is happening, which customer groups are driving expansion MRR, and how fast different groups churn. Those cohorts then feed the forecast in the next section.
If your billing, CRM, and accounting data are fragmented, Phoenix Strategy Group can help unify them into a cohort-ready LTV model.
Use the cohort inputs above to split historical LTV from forecasted LTV.
Next, calculate what each cohort has produced so far before you layer in any forecast assumptions.
For each cohort, create a month-by-month row that tracks beginning MRR, expansion MRR, contraction, churn, and ending MRR. The roll-forward is simple: beginning MRR + expansion - contraction - churn = ending MRR. Then apply gross margin to each month and add up the gross profit.
Here’s a simple example: a January 2025 cohort starts at $10,000 MRR. In month 2, it adds $1,000 in expansion. In month 3, it loses $500 to churn. At an 80% gross margin, you’d calculate each month’s gross profit on its own - $8,000, $8,800, and $8,400 - and then sum them. That running total is your observed LTV. It’s a much better read than assuming flat ARPA.
Once you have observed LTV, you can extend younger cohorts with steady-state churn and expansion rates.
You can’t get full observed LTV for younger cohorts yet. So the move is to use steady monthly assumptions based on older cohorts.
Look at cohorts that are at least six months old. After the early churn spike - usually months 1 through 3 - where do their monthly churn and expansion rates land? If cohorts older than six months keep showing 2% monthly churn and 1.5% monthly expansion after month 3, use those same rates to project younger cohorts forward, month by month.
Keep the early months on actuals. Then cap or taper expansion once it starts to flatten. That gives you assumptions you can check, explain, and defend.
That forecast becomes the expansion-adjusted LTV you compare with base-only LTV.
The gap between base-only and expansion-adjusted LTV can be large, and it changes how much CAC you can support. Base-only LTV leaves out expansion.
For example, a $100 ARPA cohort with 80% gross margin and 3% monthly churn produces a base-only LTV of about $2,667. If that same cohort also expands over time, the expansion-adjusted LTV will come out much higher. Use that gap to reset CAC targets and payback expectations by segment.
The practical takeaway is simple: base-only LTV can understate CAC capacity for segments that expand after signup. At the same time, one blended expansion rate can make SMB LTV look better than it is. Build your spreadsheet so you can toggle churn and expansion rates separately. The model is sensitive to both, and that’s exactly why this setup matters.
Use expansion-adjusted, cohort-based LTV to set CAC limits, payback goals, and ARR plans. This ties customer economics to your revenue plan instead of treating them like separate models.
Use LTV ÷ fully loaded CAC to check acquisition efficiency. Use CAC ÷ monthly gross profit per customer to estimate payback.
In U.S. SaaS, an LTV/CAC below 1.5x usually points to weak unit economics. A ratio between 2x and 3x is healthy for most growth-stage companies. Above 3x can point to strong economics, or it can mean you're not spending enough on acquisition.
If expansion increases contribution over the first 6–12 months, payback gets shorter. But that only works if you model the ramp in a grounded way instead of assuming the customer delivers the same contribution from month one.
Feed cohort-level LTV into your MRR roll-forward:
Beginning MRR + New MRR + Expansion MRR − Contraction MRR − Churned MRR = Ending MRR
Then calculate ARR = ending MRR × 12. That keeps your unit economics and revenue forecast aligned.
Use expansion-adjusted LTV to set CAC limits, payback goals, and ARR plans.
Most LTV mistakes come from shaky assumptions, not math errors. Here's where teams usually get tripped up:
| Distortion | Likely Impact on LTV | Guardrail |
|---|---|---|
| Mixed segments | Masks different churn and expansion patterns across SMB, mid-market, and enterprise | Build segment-specific LTV and report it separately |
| Perpetual high expansion assumed | Projects unrealistically high LTV when early upsell was a one-time event | Cap long-term expansion rates; validate that expansion decays over time using multi-year cohort data |
| Using logo churn as the primary metric | Hides dollar loss from large-account churn | Model revenue churn at the cohort level |
| Revenue-based LTV (no gross margin) | Inflates LTV in businesses with meaningful COGS - infrastructure, support, third-party fees | Always apply gross margin; update LTV quarterly if margin shifts materially |
| Over-relying on early cohorts | Creates optimistic LTV that may not reflect customers acquired through newer channels or markets | Weight recent cohorts appropriately; use conservative assumptions anchored to the last 12–24 months |
| Ignoring contraction in forward cohorts | Overstates future LTV | Track contraction in the roll-forward and forecast it separately |
Run scenario analysis on a regular basis, not just when you first build the model. A 50% churn shock, a 50% expansion slowdown, or a 20% CAC increase each tests a different weak spot.
If LTV/CAC falls below 2x under a churn shock, that's a clear sign to revisit acquisition spend.
Keep the model simple, cohort-based, and conservative.
Start with gross-margin-based LTV. Split base revenue from expansion. Use cohort behavior instead of blended averages. Forecast younger cohorts with stable, conservative assumptions based on older cohorts. Then check the full model quarterly against what happened in the business.
That discipline - observed data first, conservative forecasts second, regular updates third - is what separates LTV models that hold up in investor meetings from ones that quietly fall apart under scrutiny. Refresh the model quarterly and use it to reset CAC, payback, and segment targets.
Move past the simple LTV formula once your business starts to scale or when core inputs like pricing, customer mix, or acquisition channels begin to shift. That formula can work fine for stable, early-stage companies. But in a business that moves around more, it can point you in the wrong direction.
The time to switch is when blended averages start hiding what’s going on under the hood. Maybe newer cohorts are keeping customers for less time. Maybe one segment pays back fast while another takes much longer. If you rely on one static number, those changes can stay buried for 12 to 18 months.
Start with 3 to 4 cohorts, and make sure each one has at least 12 months of history. That gives you enough time to see renewal cycles and seasonality instead of judging people too early.
A good target is 12 to 24 months of data. That usually lines up with the rule of thumb of about 10 to 20 churn events per predictor.
If you use less than 12 months, the model can look precise on paper but still miss the bigger picture, like long-term retention and future behavior.
Yes. Track contraction separately from churn:
Keeping those apart gives you a cleaner read on what’s driving LTV. If you blend them together, expansion can hide the gap between logo churn and revenue churn. Renewal timing can also create sharp cliff effects that a single churn rate might gloss over.