Published on
September 6, 2026

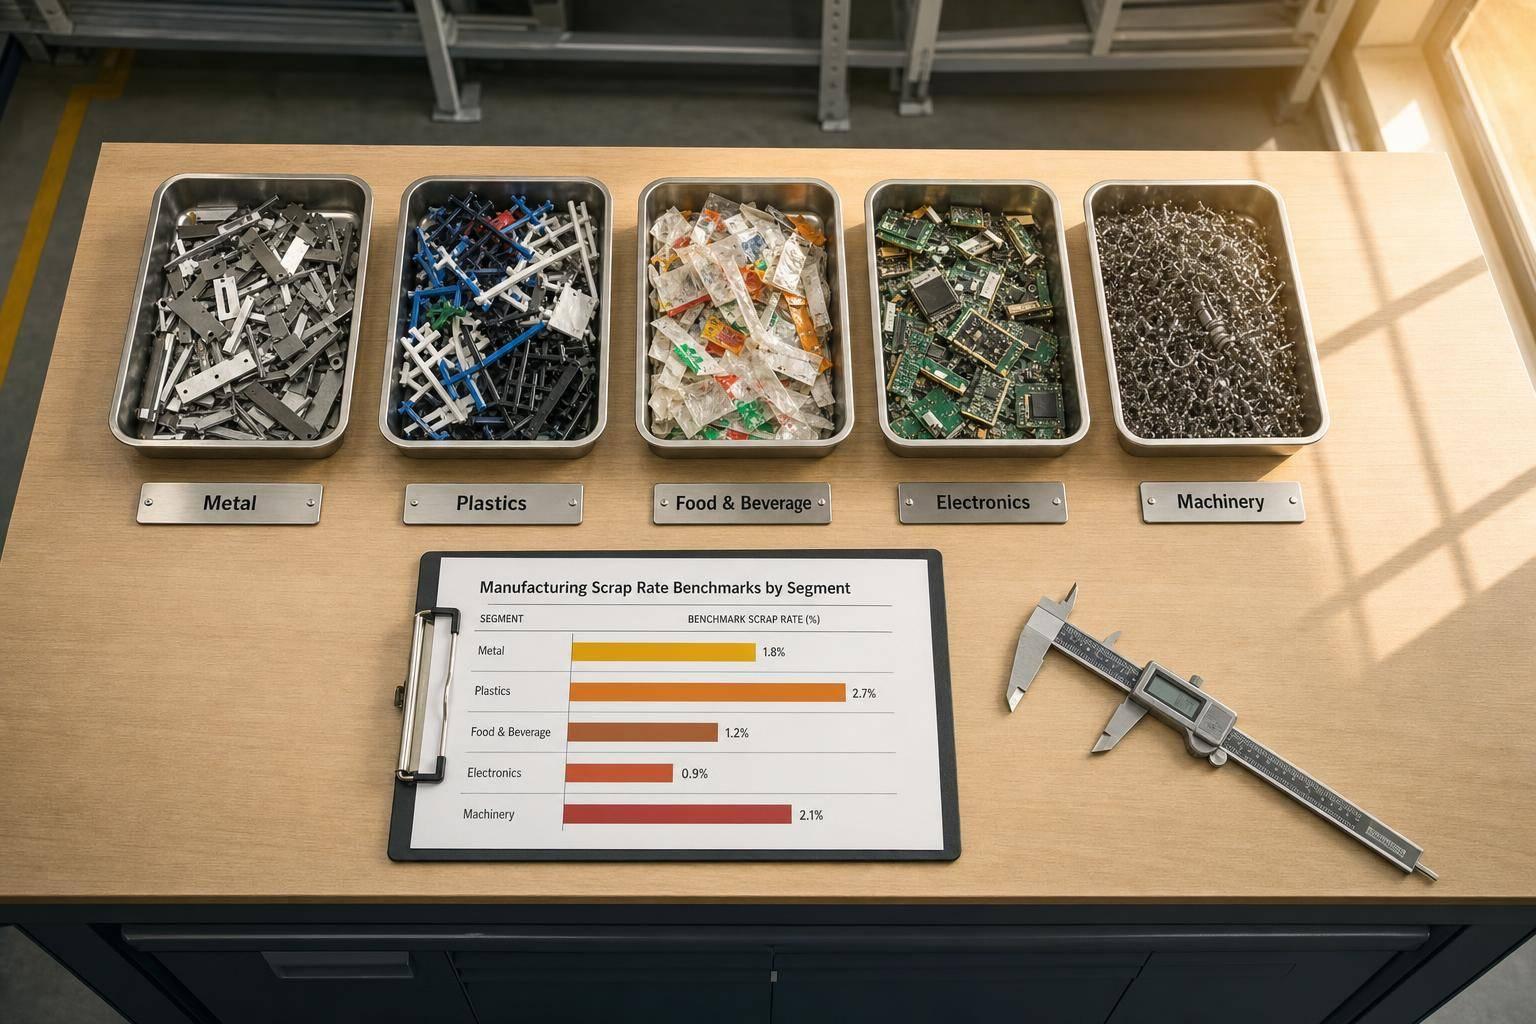
Scrap does not hit every manufacturer the same way. A small loss can be painful in food processing and steel, while some machinery and beverage businesses have more room before margin gets squeezed.
Here’s the short version: I’d group scrap benchmarks by segment, then narrow them by process type, material cost, and production mix. Across this article, the five segments are metal fabrication, plastics manufacturing, food and beverage manufacturing, electronics assembly, and industrial equipment manufacturing. The main point is simple: the right scrap target depends on how you make the product and how much each mistake costs.
A few numbers show why this matters:
So if you want a useful benchmark, I would keep four checks in mind:
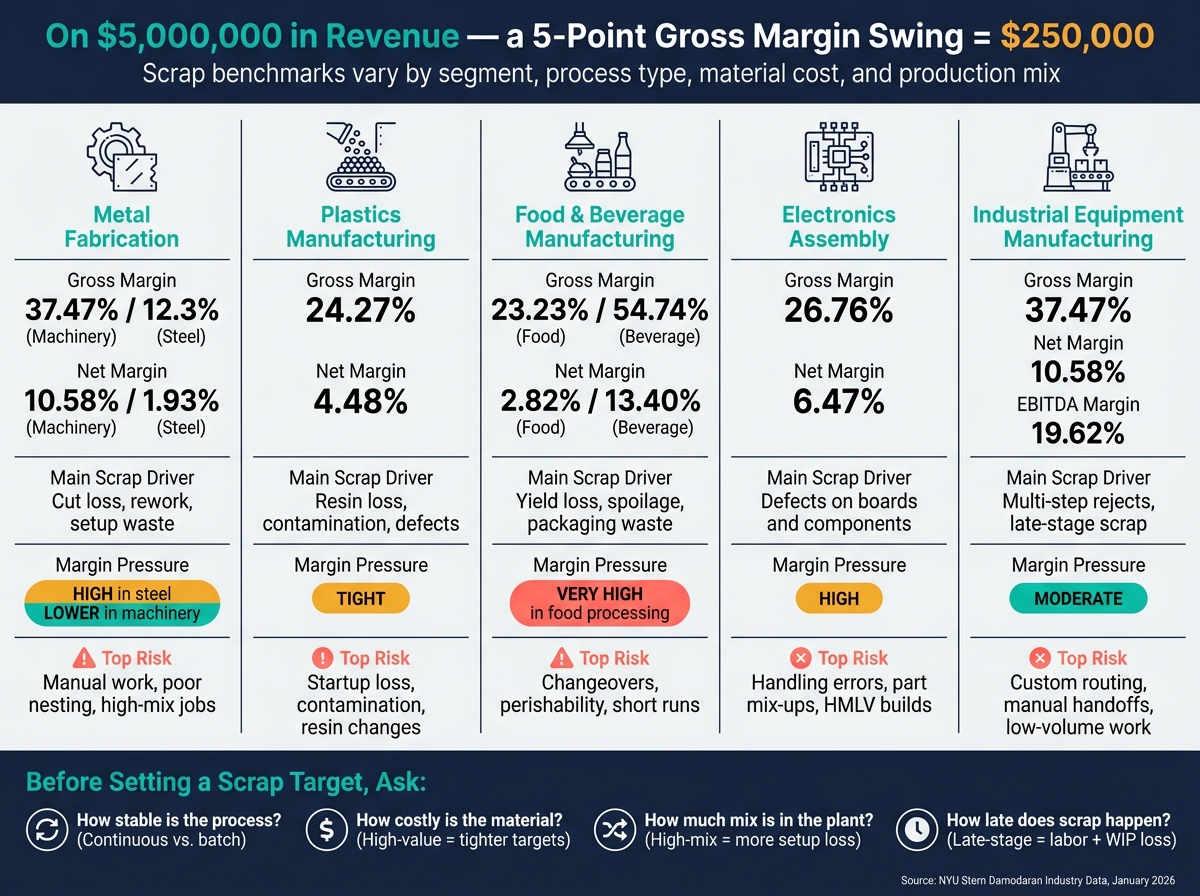
Manufacturing Scrap Rate Benchmarks by Segment: Margins & Key Drivers
| Segment | Main Scrap Driver | Margin Pressure | What Usually Pushes Scrap Up |
|---|---|---|---|
| Metal Fabrication | Cut loss, rework, setup waste | High in steel, lower in machinery | Manual work, poor nesting, high-mix jobs |
| Plastics Manufacturing | Resin loss, contamination, defects | Tight | Startup loss, contamination, resin changes |
| Food and Beverage | Yield loss, spoilage, packaging waste | Very high in food processing | Changeovers, perishability, short runs |
| Electronics Assembly | Defects on boards and components | High | Handling errors, part mix-ups, HMLV builds |
| Industrial Equipment | Multi-step rejects, late-stage scrap | Moderate | Custom routing, manual handoffs, low-volume work |
If I were using this article to set targets, I would not ask, “What is the average scrap rate?” I’d ask, “What should scrap look like for this segment, on this process, with this mix, at this margin level?”
Metal fabrication can swing a lot when it comes to scrap rates. The range usually depends on how the shop runs. CNC-heavy shops tend to land on the lower end, while manual, high-mix operations often end up on the higher end. Put simply: scrap targets in metal fabrication depend mostly on process mix. CNC-driven work is usually tighter than manual, mixed-job production.
CNC-heavy fabrication usually creates less scrap than manual cutting, welding, and rework-heavy operations. The reason is pretty simple. Automated, repeatable cuts help limit material loss from the start, while manual processes bring more variation and more chances for rework.
Steel operations often run on thin margins, so even a small bump in scrap can eat into profit fast. Scrap cuts straight into margin, which makes waste control a bigger deal in metal fabrication than in segments with more room in pricing.
High-mix work tends to drive more setup waste and more rework. Standardized runs usually make tighter scrap control easier. If scrap starts climbing, check cut quality, nesting, and rework first.
Plastic processing changes the benchmark drivers. Instead of cutting waste, the main issues shift toward resin loss and process stability.
Unlike metal fabrication, plastics scrap usually comes down to resin loss and contamination, not cut waste. A common stand-in for this space is the broader Packaging & Container sector, which reports a gross margin of 24.27% and a net margin of 4.48% [1]. That’s a thin margin. In plastics, even small resin losses can eat into profit fast.
For plastics, it makes more sense to benchmark by material efficiency and defect rate instead of forcing everything into one scrap percentage. One process may run clean with low loss, while another may deal with more defects or tighter quality limits. Trying to use one number across all of them can muddy the picture.
Resin cost is a big reason scrap hurts so much in plastics. When net margin sits at just 4.48%, there isn’t much room for contamination or scrap that can’t be reused [1]. Regrind can bring some of that cost back, but only if product specs allow it and contamination stays under control. If quality slips, the savings can disappear in a hurry.
High-volume, standardized runs are easier to measure because material use tends to repeat from batch to batch. High-mix work is different. It usually needs product-level targets, since scrap can swing based on part design, setup, and resin type. If margins fall below 24.27%, it’s worth taking a hard look at scrap and material cost [1].
These drivers change again in food and beverage, where yield loss matters more than scrap terminology.
In food and beverage, scrap usually shows up as yield loss or waste. Different label, same hit to the bottom line. A simple way to set waste limits is to look at the margin gap: food processing usually needs tighter controls than beverage because there’s less room for mistakes. In practice, the first thing to pin down is where the waste is coming from - spoilage, changeovers, or packaging loss.
| Sector | Gross Margin | Net Margin | Inventory / Revenue |
|---|---|---|---|
| Food Processing | 23.23% | 2.82% | 13.4% |
| Beverage (Non-Alcoholic) | 54.74% | 13.40% | N/A |
Source: NYU Stern Damodaran Industry Data, January 2026 [1].
Perishability changes everything. On continuous lines, product moves fast, so there’s less time for spoilage to creep in. Batch production is a different story, especially for seasonal or short-run items. That setup tends to carry more risk. Sanitation changeovers, cold-chain handling, and shelf-life limits also push yield loss up.
With a net margin of just 2.82%, food processors don’t have much cushion [1]. That’s why high-cost ingredients call for tighter scrap targets than commodity inputs. If margin slips below the sector average, waste, shrink, and ingredient loss are smart places to check first.
Benchmarks in food can shift fast when SKU count, packaging load, and shelf life change. Seasonal SKUs, short runs, and packaging-heavy items often need product-level yield targets instead of one plant-wide number. That makes sense: one line may run smoothly, while another quietly leaks margin through extra handling and pack loss.
Packaging scrap can add up fast when it stacks on top of ingredient loss. And that hurts even more in food processing, where margins are already thin. The packaging and container sector itself runs at a 24.27% gross margin [1].
The next segment shifts from waste loss to defect-driven scrap.
Electronics scrap looks very different from food and beverage waste. In this setting, scrap usually comes from defects, and it tends to pile up around expensive boards and components.
That matters because even a small bump in scrap can eat into margin fast. Rework is costly, and in some cases the board is simply lost. The Electronics (General) subsector runs at a 26.76% gross margin and a 6.47% net margin as of January 2026 [1]. If gross margin slips below 26.8%, scrap rates and material costs are some of the first areas to check [1].
| Metric | Electronics (General) | Computers & Peripherals | Semiconductors |
|---|---|---|---|
| Gross Margin | 26.76% [1] | 38.36% [1] | 58.97% [1] |
| EBITDA Margin | 12.36% [1] | 25.32% [1] | 36.77% [1] |
| Net Margin | 6.47% [1] | 17.78% [1] | 30.45% [1] |
| Inventory / Revenue | 18.1% [1] | Not listed | 14.9% [1] |
Automation helps by cutting handling mistakes and keeping scrap in check. That lines up with the broader trend: U.S. productivity gains in computer and electronic products have been the strongest in manufacturing [1].
This is where the economics get painful in a hurry. When a component fails, the loss is not just the part itself. It also ties up cash in inventory and work in process.
The higher the part value, the tighter the scrap target needs to be [1]. A mistake on a low-cost item is one thing. A mistake on a loaded board or high-value component is a very different story.
High-mix, low-volume (HMLV) work puts more pressure on component control. More changeovers mean more chances for the wrong part, obsolete stock, or setup-related scrap [1]. That’s why higher-complexity, high-mix lines have less room for scrap and need tighter control over components.
The pattern changes again in industrial equipment, where lower volumes and heavier assemblies shift the scrap profile.
Industrial equipment scrap doesn’t usually show up in just one place. It tends to build across several stages of production. In this segment, grouped under machinery, the sector posts a gross margin of 37.47% [1], an EBITDA margin of 19.62% [1], and a net margin of 10.58% [1] as of January 2026. That margin profile gives manufacturers a bit more room to absorb scrap than sectors with tighter margins.
| Metric (Machinery Sector, 2026) | Benchmark |
|---|---|
| Gross Margin | 37.47% [1] |
| EBITDA Margin | 19.62% [1] |
| Net Profit Margin | 10.58% [1] |
| Inventory / Revenue | 16.6% [1] |
| Net CapEx / Revenue | 4.14% [1] |
Industrial equipment usually passes through several production steps, including machining, welding, fabrication, and final assembly. Every handoff adds another chance for scrap to enter the process. The sector’s CapEx-to-depreciation ratio stands at 67.9% [1], which points to a mature asset base. So when teams set scrap benchmarks, it makes more sense to judge performance against existing equipment, not against some ideal fully automated setup.
That matters because a reject in this kind of operation often happens late in the process. By then, the part already has time, labor, and shop resources tied up in it.
Scrap in industrial equipment is rarely a small hit. In many cases, the part has already moved through several routing steps before it gets rejected. That means the loss is not just raw material. It also includes labor, machine time, and overhead that have already been loaded into the part.
The sector also holds inventory equal to 16.6% of annual revenue [1], which makes the carrying cost of work-in-process hard to ignore. When one part gets scrapped, the waste can stack up fast.
This sector often runs low-volume, high-mix production. That kind of work makes scrap harder to control because custom orders tend to bring more routing mistakes, tracking issues, and process variation. As process flow shifts and automation levels change, those pressures can move with it too.
Operating conditions decide whether a plant should aim for the low end or the high end of its scrap range. Process type, automation level, material cost, and production mix all affect that target. Put simply: these factors push a plant toward one side of its segment range or the other.
The first factor is whether production runs steadily or resets between runs. Continuous processes tend to keep output stable, which makes scrap easier to predict. Batch operations restart from one run to the next, and every changeover adds more variation.
That difference shows up fast on the floor. Industrial equipment manufacturing, with multi-step routing and low-volume orders, usually faces more scrap pressure during those reset points than a food and beverage line running at a steady pace.
Automation tends to cut scrap because it reduces handling mistakes, rework, and setup variation. Electronics assembly is a good example. It depends heavily on automated placement and inspection, so scrap stays tighter. Industrial equipment manufacturing involves more manual work, which leaves more room for output variation.
Once process stability is in place, the next issue is material value. That changes how painful each defect becomes.
Material cost has a direct effect on the damage a scrap event causes. In steel and metal fabrication, gross margins are just 12.3% [1], so even a small amount of waste can eat into profit in a hurry.
In electronics assembly, the hit can be even sharper than it looks at first glance. A defect on a loaded board is not just a lost part. It also wipes out the labor and components already built into it. That's why tight scrap control matters so much, even when gross margins seem stronger on paper.
Volume and variety pull scrap benchmarks in opposite directions. High-volume, standardized runs, like those in plastics manufacturing, make it easier for teams to set steady material efficiency targets because the same inputs and outputs repeat from batch to batch.
High-mix, low-volume work, like industrial equipment manufacturing, is a different animal. It brings more routing changes, custom setups, and process variation. That drives up the cost of each scrap event. The buffer helps, but each scrap event still ties up labor and capital.
At this point, the focus moves from benchmark ranges to what those numbers mean in day-to-day terms: margin, cash flow, and how much scrap a business can live with before it starts to hurt.
Some segments have a bit of breathing room. Others don't. And that difference matters a lot when scrap shows up on the floor, during changeovers, or late in production.
Metal fabrication lands somewhere in the middle. Machinery operations can absorb a moderate amount of scrap because margins are stronger. But steel is a different story. With thin net margins and cash still tied up in WIP and working capital, scrap hits harder and faster.
Plastics manufacturing has a split profile. Packaging lines can usually handle routine process loss. But negative-margin segments like rubber and tires don't have that cushion. In those operations, startup scrap can turn into immediate financial damage, especially when regrind options are limited or contamination risk is high.
Food and beverage breaks into two very different scrap profiles. Non-alcoholic beverage producers have more room to absorb sanitation loss and changeover waste. Food processing does not. There, perishability waste and yield loss during line changeovers need tight control because margins are much thinner.
Scrap tolerance is tight in electronics. A defect doesn't just waste raw material - it can take out expensive components and loaded boards. Then rework piles on extra labor and downtime. Even a small scrap rate can get expensive fast when component value is high and equipment time is costly.
Industrial equipment is one of the more balanced segments in the group. Still, custom builds tie up cash in inventory and WIP, which changes the math. Late-stage scrap is especially painful because by the time a part gets rejected, labor, machine time, and overhead are already built into it.
| Segment | Pros of Benchmark Profile | Cons of Benchmark Profile | Financial Implication |
|---|---|---|---|
| Metal Fabrication | Machinery's 37.5% gross margin and 10.6% net margin provide a buffer for job-mix variability [1] | Steel's 1.93% net margin leaves little room for raw material waste [1] | Scrap is more damaging in steel than in machinery |
| Plastics Manufacturing | Packaging and containers show a 24.3% gross margin and 13.6% inventory-to-revenue [1] | Rubber and tires have a -9.49% net margin [1] | Material waste and startup scrap can quickly erode profit |
| Food and Beverage Manufacturing | Non-alcoholic beverages have a 54.7% gross margin [1] | Food processing net margin is only 2.82% [1] | Waste from sanitation, changeovers, and perishability must stay tightly controlled |
| Electronics Assembly | Strong productivity gains help contain handling-related scrap | Semiconductor CapEx intensity is 19.05% of revenue [1] | Defects are expensive because of component value and equipment downtime |
| Industrial Equipment Manufacturing | Machinery delivers a 10.6% net margin and 19.6% EBITDA margin [1] | 16.6% inventory and 24.4% non-cash working capital tie up cash [1] | Scrap slows cash conversion and makes rework costly |
Scrap benchmarks change by segment, so treat them as guideposts, not hard targets. That matters because even small shifts in scrap can hit profit fast.
On $5,000,000 in revenue, a 5-point swing in gross margin equals $250,000. That’s why scrap belongs inside margin planning, not off to the side.
When teams use scrap benchmarks to make decisions across operations and finance, the metric becomes far more useful for planning and investor discussions. Tying scrap to FP&A, unit economics, and working capital helps turn a shop-floor number into something finance can actually use. Phoenix Strategy Group helps manufacturers put those numbers in financial context.
Benchmark against your segment and your own process conditions. Then measure the gap in dollars, not just percentages.
Start with a clear baseline. Then connect the target to cost and capacity, so the team sees what the number means in day-to-day terms.
Separate pure waste - scrap, rework, and defects - from other loss categories. The goal is to eliminate that waste, not just trim it a little.
Use line-level and shift-level data to spot where losses first show up. From there, model how changes in scrap rate affect annual material loss. Even a small rate shift can add up fast over a year.
Set separate targets for lines that are less stable, like new-hire lines or learning lines. That keeps expectations fair while quality settles down.
It depends on the production setup, but for most manufacturers, the main KPI is scrap rate by line, shift, or SKU. That kind of detail makes it much easier to connect shop-floor losses to margin pressure.
In high-value or complex processes, such as additive manufacturing, track scrap along with distortion and shrinkage. Across any segment, keep scrap, rework, and downtime separate so you can see what’s actually cutting into profit.
Measure scrap in dollars when you need to see the direct hit to the business, especially for high-value materials or specific production runs.
Percentages are useful for tracking shop-floor efficiency. But dollar values do a better job when you're estimating annual profit loss, making the case for capital investment, or pinpointing which SKUs or processes are cutting into gross margin the most.