Published on
September 6, 2026


LTV is not customer revenue. It is the gross profit you expect from a customer over time. If I model it the right way, I can tie retention, margin, CAC, and payback into one clear view of how a subscription business works.
Here’s the short version:
A fast check is:
LTV ≈ ARPU × Gross Margin ÷ Monthly Churn
But I would only use that as a rough estimate. It can miss changing churn, expansion revenue, and differences across cohorts.
A simple example from the article makes the point fast: with $49.00 ARPU, 80% gross margin, and 5% monthly churn, implied LTV is about $784.00. That number changes if retention shifts by cohort or if later-month expansion adds more gross profit.
What matters most is this:
If I want a model that is useful for pricing, forecasting, and cash planning, cohort-based LTV is the way to do it.
Start with five inputs: ARPU, gross margin, churn, cohort timing, and discount rate. Get any one of them wrong - or define it one way in one tab and another way somewhere else - and the model can look neat on the surface while missing what's happening in the business.
ARPU = monthly recurring revenue ÷ paying customers. If your MRR is $125,000 and you have 1,000 paying customers, ARPU is $125.00 per customer per month.[7] Keep the denominator clean. That means leaving out free trials, paused accounts, and free-plan users so the number doesn't get skewed.
Gross margin is (Revenue − COGS) ÷ Revenue. In SaaS, COGS often includes hosting, payment processing, and support. So if a customer pays $125.00 per month and your gross margin is 80%, the gross profit per customer is $100.00 per month. That's the number that should go into your LTV model - not the full $125.00.[6]
That difference matters more than it may seem. Two SaaS companies can post the same ARPU and still end up with very different LTVs if one costs more to serve.
For churn, pick your definition before you build the model:
Use logo churn for flat-priced plans.[8] If expansion and contraction matter, use revenue churn or NRR instead. Just don't combine logo churn and revenue churn in the same formula. That's where LTV models start to go sideways.
Your cohort interval should match the way you track churn and CAC payback. For most subscription businesses, monthly is the best default. Billing cycles, churn reviews, and CAC payback are often tracked monthly, so keeping the cohort interval monthly helps the model stay internally consistent.[3][4] It also helps you avoid unit mismatch, which can quietly overstate LTV.
Group customers by signup month, then measure retention at Month 0, Month 1, Month 2, and so on. Month 0 is your acquisition baseline. Use that same monthly rhythm across retention, churn, and CAC payback.
For subscription businesses with a longer customer life, discounting future cash flows matters because money collected later is worth less than money collected today.[5]
If you're applying discounting monthly, convert the annual discount rate with (1 + r)^(1/12) − 1. With a 12% annual discount rate, the monthly rate is about 0.95%.[5] Apply that monthly rate to each month's expected gross profit in the retention curve.
That keeps discounting on the same monthly schedule as retention, which is exactly what you want before moving into the next step.
Lock these assumptions first—a process often managed by fractional CFO services. Then build the cohort retention table in Step 2, where retention turns into a monthly revenue curve.
With your Step 1 inputs set, the next job is to turn billing data into a cohort retention grid. A single churn rate can flatten the story. A cohort curve shows when customers drop off, and that timing matters.
Start with five fields from your billing system:
Use recurring subscription revenue only. Leave out one-time charges and taxes.
Next, group customers by first paid month. So if someone first paid in January 2025, they belong to the 2025-01 cohort.
Then calculate months since first paid month for each invoice record:
(invoice year − cohort start year) × 12 + (invoice month − cohort start month)
Month 0 is the first paid month. Month 1 is the following month.
From there, build a grid with cohort months as rows and months-since-start as columns. Each cell should show the percent of that cohort still active at that point in time. If the January 2025 cohort started with 1,000 customers and 800 are still active in Month 3, that cell is 80%. Month 0 is always 100% by definition.
A heatmap helps you spot weak cohorts fast. And this curve becomes the monthly input for LTV and CAC payback.
Use first paid month as the cohort anchor, not the trial start date. Trials haven’t turned into revenue yet, so using them can muddy a model that’s meant to reflect paying customer relationships.[9]
Once the retention grid is ready, multiply each month’s retention rate by your ARPU to get expected revenue per starting customer for that month.
If Month 3 retention is 80% and ARPU is $50.00, then revenue per starting customer in Month 3 is $40.00.
Multiply that figure by cohort size to get total expected cohort revenue for the month. That gives you the revenue curve. Gross profit comes after that. If you’re modeling gross-profit LTV, apply gross margin to this curve before discounting.
If customers expand after signup, logo retention by itself can miss part of the picture. That’s why it helps to build a revenue retention curve next to the logo retention curve. To do that, divide cohort MRR in each month by that cohort’s starting MRR.
A January 2025 cohort generating $60,000 in Month 12 from a $50,000 starting MRR has an NRR of 120% at that point.
For B2B SaaS, median NRR is about 101–102% across all segments, and closer to 118% for Enterprise accounts with ACV above $100,000.[10][11] These benchmarks are useful for checking whether your extraction logic and metric definitions line up with reality.
To finish the model, tag each customer-month by MRR change type:
Then aggregate those changes by cohort and month. The result is your effective revenue per starting customer for each month, which becomes the monthly revenue curve for Step 3.
LTV:CAC Ratio Benchmarks & CAC Payback: SaaS Unit Economics Guide
With your cohort revenue curve in place, you can turn monthly retention into one LTV figure and stack it up against customer acquisition cost.
Once you have the retention curve, LTV is simply the total expected gross profit from that cohort over time.
Start with gross profit per customer per month. Take ARPU and multiply it by gross margin. If ARPU is $100 and gross margin is 70%, that gives you $70 in gross profit per customer per month. Then multiply that amount by the retention rate in each month and add those monthly values across the customer lifespan. That total is your simple LTV.
Use the shortcut LTV ≈ (ARPU × Gross Margin) ÷ Monthly Churn only as a quick gut check against the cohort-based total.[12][14] If the two numbers are far apart, that usually means churn is not flat, expansion revenue is in play, pricing changed, or cohort timing is affecting the result.
You can also discount future gross profit using a monthly rate based on your annual hurdle rate: Discounted LTV = Σ [Gross Profit_t ÷ (1 + r)^t].[12][2][20] This gives less weight to cash flows that arrive later, which makes the figure more useful in fundraising, capital allocation, and valuation discussions.
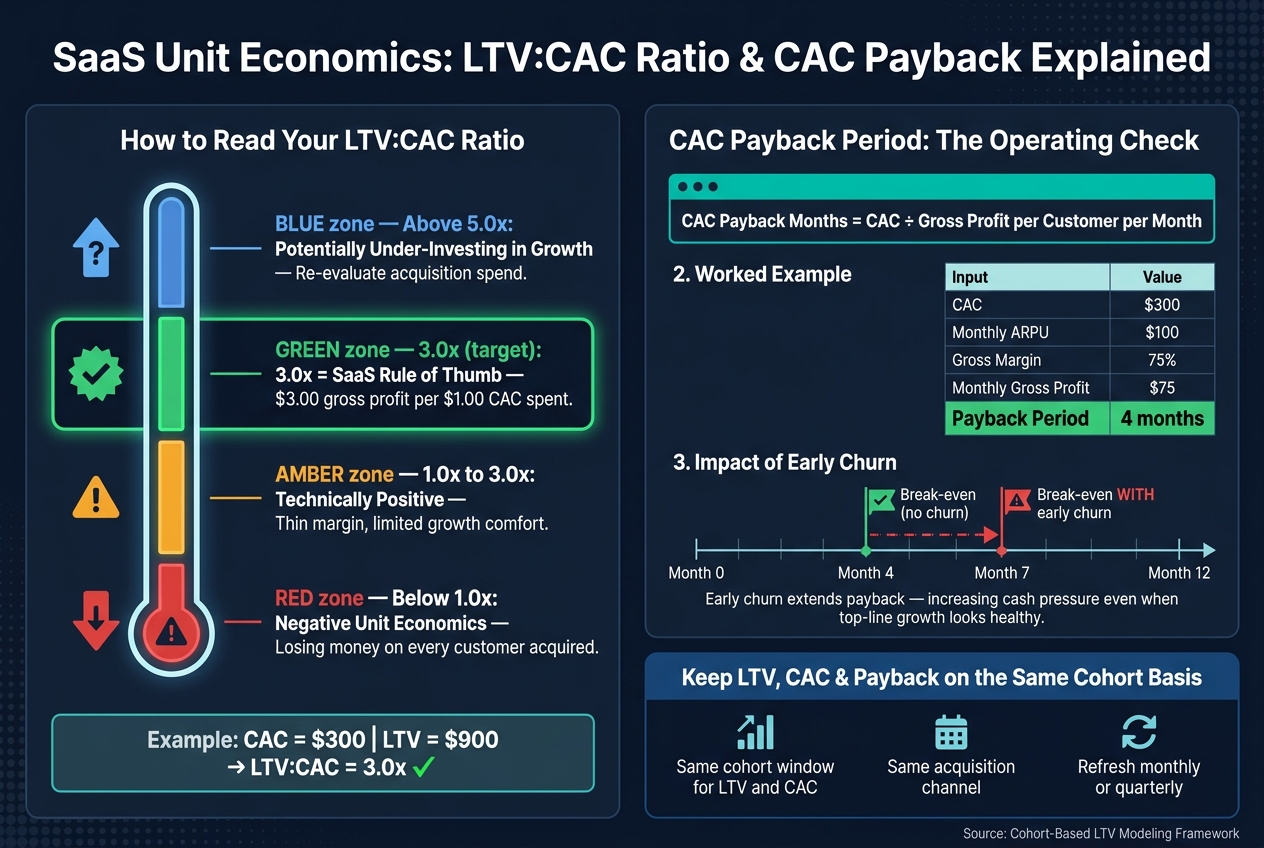
Of course, LTV on its own doesn't say much. It starts to matter when you compare it with what you paid to acquire those customers.
Use the same cohort basis for CAC that you used for LTV. Otherwise, the math can look clean while the economics are off.
CAC is total sales and marketing spend divided by new customers acquired in the same period. If you spent $150,000 in Q1 2026 and acquired 500 new customers, your CAC is $300.
Divide LTV by CAC to get the LTV:CAC ratio. This is a direct read on acquisition efficiency.[17][18][19] The key is consistency: keep LTV and CAC tied to the same cohort and acquisition channel. If you compare a mature cohort's LTV with a blended current-period CAC, the ratio can get warped.
Here's how to read it:
CAC payback months shows how long it takes to earn back acquisition cost through gross profit: CAC ÷ gross profit per customer per month.[1] If CAC is $300 and monthly gross profit is $75, payback is 4 months before churn is factored in.
That last part matters. Early churn pushes payback out. And the longer payback gets, the more cash pressure you take on. A channel can look great on a lifetime basis and still be a cash hog upfront.
So think of CAC payback as the operating check on your LTV model. Measuring LTV:CAC and payback on the same cohort and acquisition channel keeps the model grounded in actual customer behavior and makes it useful for the forecasting and planning work in Step 4.
Once Step 3 gives you LTV, CAC, and payback, put the model to work in revenue planning, cash planning, and board reporting. This shouldn’t be a one-and-done exercise. The cohort model needs to live inside your monthly operating rhythm.
Take the retention curve for each monthly cohort, multiply it by ARPU and gross margin, and roll that forward into monthly or quarterly revenue and gross profit forecasts. From there, use the output in board decks and operating reviews to track cohort revenue, gross profit, CAC payback, LTV:CAC, and cash burn.
Here’s why that matters: if a cohort’s payback period moves from 10 months to 16 months after churn gets worse, that’s a cash warning sign even when top-line growth still looks good. On paper, growth may seem fine. Under the hood, the engine is burning more cash.
Refresh the model every month, or at least every quarter. Old assumptions can throw off forecasts fast after shifts in retention, pricing, channel mix, gross margin, or product lines. That’s what turns the model from a static finance exercise into an operating tool.
Things can get messy fast when you have multiple products, several sales channels, or source data that doesn’t line up cleanly. At that point, it’s hard to trust the model at all.
If data quality keeps you from getting to that level of trust, outside support can help. A fractional CFO or FP&A partner can clean up cohort definitions, align active versus churn status, and plug the model into forecasting and cash planning. Phoenix Strategy Group helps growth-stage companies standardize cohort definitions, clean up subscription data, and integrate the model into forecasting and cash planning.
A simple LTV formula - ARPU × gross margin ÷ monthly churn - is a useful gut check, but it's not a decision tool.[22] A cohort-based model is stronger because it shows how customer value changes over time, not just what the average says on a single day.
The core steps are pretty clear:
The model becomes useful when LTV, CAC, and payback all sit on the same cohort basis and the numbers get updated as new data comes in.
Use revenue churn for LTV because it shows how account value changes over time.
Logo churn only tells you how many customers left. That can miss the bigger picture. For example, you might lose a lot of small accounts while keeping your biggest ones, and the impact on LTV will look very different.
It helps to track both on their own so you can see what's actually driving changes in your LTV.
Update your cohort-based LTV model at least quarterly so your forecasts stay in line with actual performance, CAC payback targets, and shifts at the segment level.
If you want tighter day-to-day control, review the model monthly to track channel performance and adjust acquisition budgets. And if pricing, product, or customer mix changes in a big way, retrain the model right away.
Use the simplest formula your data and decisions support. Simple LTV is a good fit for fast, directional estimates when churn stays steady. Discounted LTV makes more sense for multi-year planning or when you need tighter payback timing.
As you grow, shift to cohort-based models so you can account for segment differences and upsell revenue. If churn moves around or payback stretches past 12 to 18 months, use a more precise model.