Published on
July 24, 2026


Most partner programs look good until you count all the costs. If I’m running a growth firm in the $500,000 to $10,000,000 revenue range, I should judge partnerships with one simple rule: ROI = (partner revenue − full partner costs) / full partner costs.
Here’s the short version:
A few facts stand out. An $8,000 partner program can become $12,000 after internal labor is added. And a company with $2,000,000 in annual revenue that spends $15,000 on a new partner program at 70% gross margin needs about $21,429 in new partner-sourced revenue just to earn back that spend on gross profit. If ACV is $7,500, that means about 3 new customers.
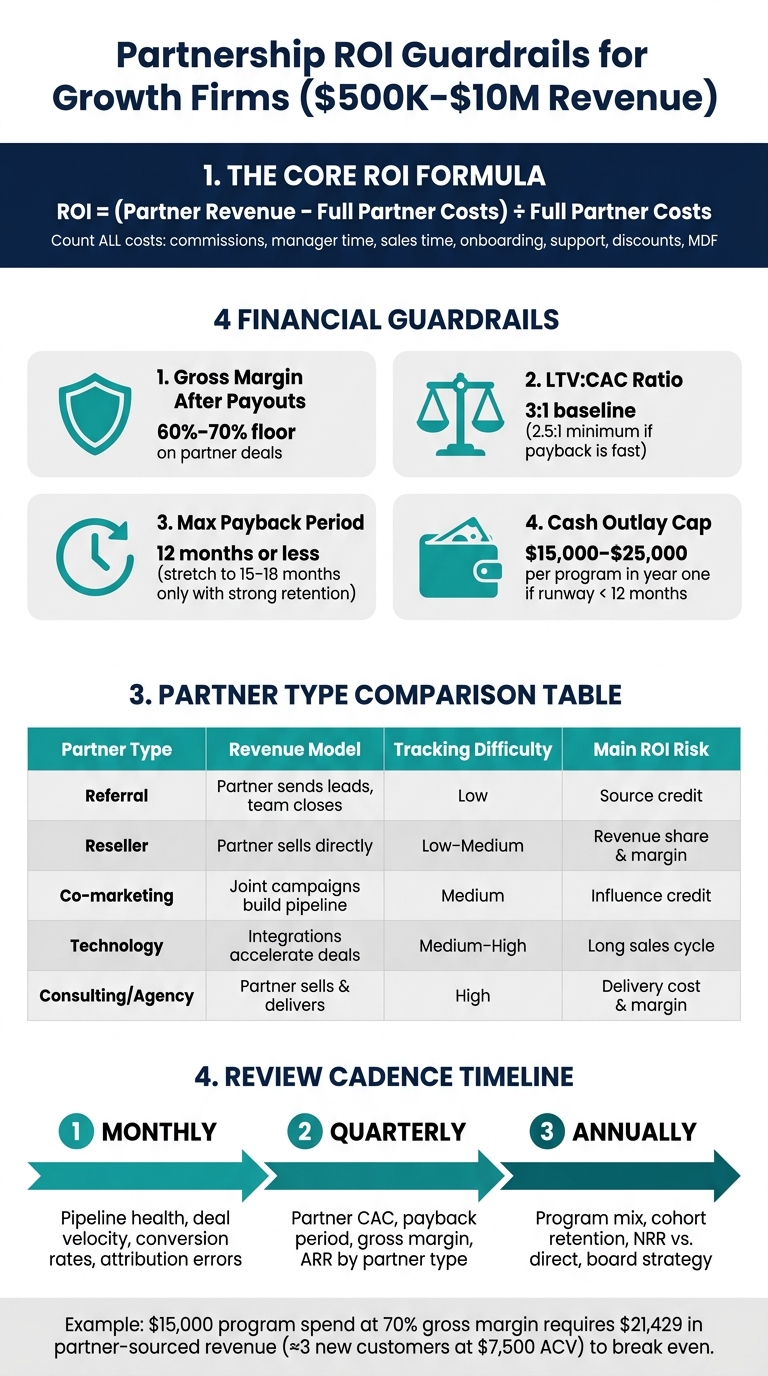
Partner Program ROI Guardrails: Key Metrics & Thresholds for Growth Firms
| Partner type | How it makes money | Tracking difficulty | Main ROI concern |
|---|---|---|---|
| Referral | Partner sends leads, my team closes | Low | Source credit |
| Reseller | Partner sells for me | Low to medium | Revenue share and margin |
| Co-marketing | Joint campaigns create pipeline | Medium | Influence credit |
| Technology | Integrations help deals close or expand | Medium to high | Long sales cycle |
| Consulting/Agency | Partner sells and delivers with my product | High | Delivery cost and margin |
So the big idea is simple: I need a lean system that ties partner deals to margin, payback, and cash use - not just pipeline. That’s what lets me decide whether to scale, pause, reprice, or cut a program.
Before you spend a dollar on commissions, discounts, or co-marketing, get specific about what the partnership needs to produce - in dollars and in months.
That means turning your annual operating plan into clear partnership targets tied to revenue, margin, sales capacity, and cash flow. Set a company-specific goal based on your current pipeline, revenue, and team capacity. And make sure everyone records those targets the same way from day one. If Sales, Finance, and Partnerships define success differently, the numbers will drift fast.
Sales capacity matters just as much as top-line targets. Say you have three account executives, and each one carries a $600,000 annual quota. A new partner program only makes sense if it lifts qualified opportunities per AE by 20% to 30% without adding more AE headcount. That constraint should shape the partnership goal before you sign anything.
Start small. Be disciplined. Track the metrics that directly shape ROI calls, and skip the vanity stuff.
| Metric | Type | Definition | Owner | Double-Counting Risk |
|---|---|---|---|---|
| Partner-sourced pipeline | Sourced | Opportunity value where partner was the first recorded source | Partnerships + Sales Ops | High - enforce one primary sourcing partner field per opportunity |
| Partner-sourced revenue | Sourced | Closed-won revenue where partner is marked primary source | Sales Ops | Limit to one sourcing partner per deal |
| Partner-influenced revenue | Influenced | Closed-won revenue where a partner co-sold or participated after opportunity creation | Partnerships + RevOps | High - report as a supporting metric, not additive to sourced revenue |
| Win rate | Both | Conversion to closed-won, tracked separately for sourced vs. non-partner deals | Sales Ops | Low if tracked at opportunity level |
| Partner CAC | Sourced | Total partnership spend ÷ new customers acquired via partner-sourced deals | Finance + Partnerships | Risk if sourced and influenced customer counts are mixed |
| Gross margin after payouts | Sourced | Gross margin on partner deals after commissions and discounts | Finance | Low if deal-level margin is tracked in CRM or billing system |
| Payback period | Sourced | Months until gross profit repays partner CAC | Finance | Low if CAC is calculated correctly |
| NRR on partner accounts | Sourced | Year-over-year net revenue change for customers acquired via partners | Finance + RevOps | Low if the cohort is clearly defined at acquisition |
Average deal size and sales cycle length help round out the picture. Track both for partner-sourced and non-partner deals. If partner deals close faster or come in at a higher ACV, that tells you something useful, and it belongs in board reporting.
Once those metrics are locked, set the financial thresholds that decide whether the program should grow.
Set four guardrails before launch:
Here’s what that looks like in practice. A U.S. SaaS company with $2,000,000 in annual revenue commits $15,000 to a new partner program for onboarding, co-marketing, and commissions. At a 70% gross margin, recovering that $15,000 in 12 months means the company needs at least $21,429 in incremental partner-sourced revenue ($15,000 ÷ 0.70).
If the average deal size through that partner is $7,500 ACV, the program needs to close at least three new customers within the year just to break even on gross profit. If actual performance lands at only $10,000 in year-one revenue, the program misses the bar. At that point, you either renegotiate the terms or cut it.
Once your targets are set, the next job is building a CRM setup that makes those numbers easy to audit. If partner data is messy, the targets don't mean much. Start with a clean data model, not more reports.
Create a Partner object connected to both Company and Deal records. Don't hide partner info in text fields or tags. That's where data goes to get lost.
Use association labels to show whether each deal was sourced or influenced. That line matters. It keeps credit clean and helps you avoid duplicate attribution in reporting.
If your CRM doesn't support custom objects, begin with lookup fields or picklists. Then move to a Partner object as volume grows. Keep the Company and Deal links in place so attribution holds up in board reporting.
That setup makes partner-sourced revenue traceable from attribution all the way into financial reporting.
After you set guardrails, the next step is simple: check whether partner economics still meet them after every cost is counted. Clean attribution helps, but it’s not enough on its own. You need to know whether partner revenue still makes money once the full picture is on the table.
The key formula is straightforward: Partnership Contribution Margin = Partnership Revenue − COGS − Partner Commissions/Rebates − MDF (market development funds) − Discounts − Onboarding and Support Allocation.[1][10]
The cost many firms miss is support time. It adds up fast.
If partner-sourced customers need 6 hours of onboarding at a fully loaded cost of $75/hour and another 4 hours of support in the first 30 days at $90/hour, that works out to $810 per customer. You don’t need to track every single minute to get there. A better approach is to use average hours by cohort, then review that estimate every quarter as the program develops.
Once you know the true margin, compare partner CAC and direct CAC using the same inputs. That means total acquisition cost per new customer, average deal size, payback period, and expansion potential. Partner channels can produce CAC 40% to 60% lower than direct, but there’s a catch: if partner deals come with deeper discounts or smaller first contracts, payback can take longer than it seems at first glance.[5][6]
| Metric | Direct Acquisition | Partner Acquisition |
|---|---|---|
| CAC payback | ~12 months[2] | Can be immediate in the referral example because the fee is less than first-year gross margin[2] |
| Cost components | Paid media, outbound labor, SDR/AE compensation, content, events, onboarding[3] | Commissions, rebates, MDF, discounts, onboarding/support, and partner-management overhead[1][3][4][10] |
| Expansion potential | Moderate | High, depending on partner type |
To keep this comparison honest, express CAC in dollars per customer and also as a percentage of ACV.[3]
Cohort views help here too. They show which partner types recover CAC the fastest instead of blending everyone into one average.
Cohort analysis keeps strong and weak partners from getting lumped together. That kind of averaging can hide bad economics in plain sight.
Group customers by partner type, partner tier, launch month, segment, or acquisition motion. Then track contribution margin, churn, and expansion at 3, 6, and 12 months. Also track cumulative gross margin by cohort month and note the month when cumulative margin moves past CAC. That’s your payback point.[8]
A referral partner cohort may convert faster but bring in smaller ACV. A technology partner cohort may ramp more slowly but deliver stronger expansion revenue. Those aren’t small differences. They should shape where your MDF and enablement dollars go.
Scenario analysis pushes this one step further. It lets you test a move before you commit budget to it. Your model should show the effect on ARR, gross margin, CAC payback, cash burn, and runway, with clear assumptions for churn, expansion, and mix shift between direct and partner channels.[7][8][9]
Here are two practical cases:
Use the model to decide whether to scale, pause, or reprice the program. A good scenario model gives you a decision rule before the next budget cycle.
Use these outputs in the monthly and quarterly review cycle.
Scenario models and cohort analysis only matter if your team looks at them on a set schedule. The goal is simple: turn those findings into a review rhythm that drives decisions. If you don't have that structure, partnership data tends to sit in spreadsheets and go nowhere.
Use three cadences: monthly for pipeline health, quarterly for ROI and unit economics, and annual for portfolio strategy.
Monthly is where you track pipeline health. That includes partner-sourced pipeline, partner-influenced pipeline, partner-driven conversion rate, deal velocity, conversion rate by stage, average deal size, and near-term revenue closed from partners. This review should catch pipeline slippage and attribution errors early. It should also surface duplicate credit and misclassified deals before they spread through your reports.
Monthly tells you that something is off. Quarterly decides whether the program should get more budget.
Quarterly is when the focus shifts to economics. Look at partnership ROI, gross margin by partner type, partner CAC, payback period, ARR influenced by partners, sourced ARR percentage, and expansion or retention trends inside partner-led cohorts. This is also the right time to make tier calls and budget decisions.
Annual reviews should test whether partner-led customers retain and expand better than direct customers, and whether the partnership mix still fits the company's growth stage.
The table below shows who owns each review and what they should watch:
| Cadence | Focus Area | Metric Owner | Key Metrics |
|---|---|---|---|
| Monthly | Pipeline & activity | Sales / Partnerships lead | Sourced pipeline, partner-driven conversion rate, deal velocity, conversion rate |
| Quarterly | Economics & ROI | Finance / RevOps | Partner CAC, payback, gross margin, ARR influenced by partners |
| Annual | Program mix and strategic fit | CEO / Founder | NRR by segment, cohort retention, program structure |
Once the operating cadence is in place, roll that same data into board-ready summaries. Boards should see six rollups:
Lock the definitions and leave them alone. If partner-sourced ARR means deals that entered the pipeline through a partner-defined origin rule, it needs to mean that exact same thing all year. Once definitions start moving, boards stop trusting the numbers.
Use one board template with fixed definitions so Finance, Sales, and Partnerships review the same numbers every cycle.
Before anything goes into a board packet, put data controls in place. Run attribution audits, require CRM fields, and reconcile partner-credited deals against actual closed-won revenue on a set schedule. One misclassified cohort can skew the whole board readout.
Define targets, set guardrails, install clean attribution, measure margin, and review on a fixed cadence. For $500,000 to $10,000,000 firms, a simple system beats a complex dashboard that no one keeps up to date.
Add up all direct and indirect costs tied to your partnership program.
That means the obvious line items, like setup and upkeep, training, marketing development funds, sales and technical support, commissions, incentives, and admin overhead.
But don’t stop there. Shared expenses matter too, and they’re easy to miss if you’re not looking for them. Include costs like:
Use a clear cost-allocation framework so you can track these items the same way over time. That gives you a cleaner view of partnership customer acquisition costs and makes it much easier to compare this channel with the rest of your acquisition mix.
Partner-sourced revenue is revenue from deals a partner started or directly drove as the main source of the opportunity.
Partner-influenced revenue is revenue from deals where a partner helped along the way, often shortening the sales cycle or helping the deal grow in size. Tracking both in your CRM gives you a clearer view of the direct and indirect impact of partnerships for board-level reporting.
Scale back or leave a partnership when it no longer fits your core business goals or keeps missing the financial marks you set.
Use quarterly reviews to see whether KPIs like revenue, pipeline growth, or operational efficiency are coming in below target. If the partnership starts holding back growth, stays out of sync on goals, or still isn’t delivering after six months of active management, it’s time to move on.