Published on
July 25, 2026


Most LTV numbers are too blunt to guide spending. I’d sum this up in one line: future customer value gets much easier to estimate when I use behavior data, not just past revenue.
Here’s the short version:
This article explains how I’d turn behavior signals like logins, feature use, payment retries, seat cuts, and support issues into a future revenue forecast. It also shows how to spot risk early, update customer health scores, and use predicted LTV in finance planning instead of leaving it stuck in an analytics report.
A predictive LTV model stands or falls on the behavior data behind it. The first job is simple to describe and hard to do well: connect billing, CRM, product, and support records into one customer view. From there, focus on three buckets: billing, usage, and data quality.
Track recency, frequency, AOV, expansion history, downgrades, renewal timing, and payment declines and retries.
Failed payments are a core billing signal. Involuntary churn from payment failures accounts for up to 40% of lost subscribers [1], and failed transactions are projected to cost subscription companies $129 billion in lost revenue in 2025 [1]. That’s not a small leak. It’s a hole in the bucket.
So don’t just log whether a payment failed. Track decline rates, retry outcomes, and what happens after each retry cycle. Those patterns often show churn risk before a customer cancels.
Billing tells you what already happened. Usage and service data give you a read on what may happen next.
Billing shows spend. Usage and service signals show whether that spend is likely to keep going.
Login frequency, session duration, and the number of features used often point to churn before it shows up in billing data. If usage starts to fade, revenue trouble may not be far behind.
Support data adds another layer. High ticket volume paired with slow resolution times can signal a higher chance of churn. NPS scores and survey feedback add context that product usage alone can miss. A customer may still log in often and still be unhappy. That gap matters.
A unified customer ID connects records across billing, CRM, product, and support. Without it, you’re not modeling customers. You’re modeling broken fragments.
Revenue numbers also need to be normalized for discounts, prorations, and refunds, so the model isn’t working from inflated totals. And you need at least 12 months of history to capture renewal cycles and seasonality [1].
For many growth-stage teams, this is where FP&A and data engineering step in. Pulling these sources together usually takes both finance context and data plumbing.
The table below shows how each input maps to the forecast outcome it affects most:
| Data Source | Example Metrics | Predicts Retention | Predicts Frequency | Predicts Revenue |
|---|---|---|---|---|
| Billing System | Recency, Frequency, AOV; Payment Success/Decline Rate; Expansion History (Upsells) | ✓ | ✓ | ✓ |
| CRM / Sales | Contract Renewal Date | ✓ | ||
| CRM / Sales | Seat Reductions / Downgrades | ✓ | ✓ | |
| Product Analytics | Login Frequency | ✓ | ||
| Product Analytics | Number of Features Used | ✓ | ✓ | |
| Product Analytics | Session Duration | ✓ | ||
| Support Platform | Support Ticket Volume | ✓ | ||
| Support Platform | Resolution Time / NPS | ✓ |
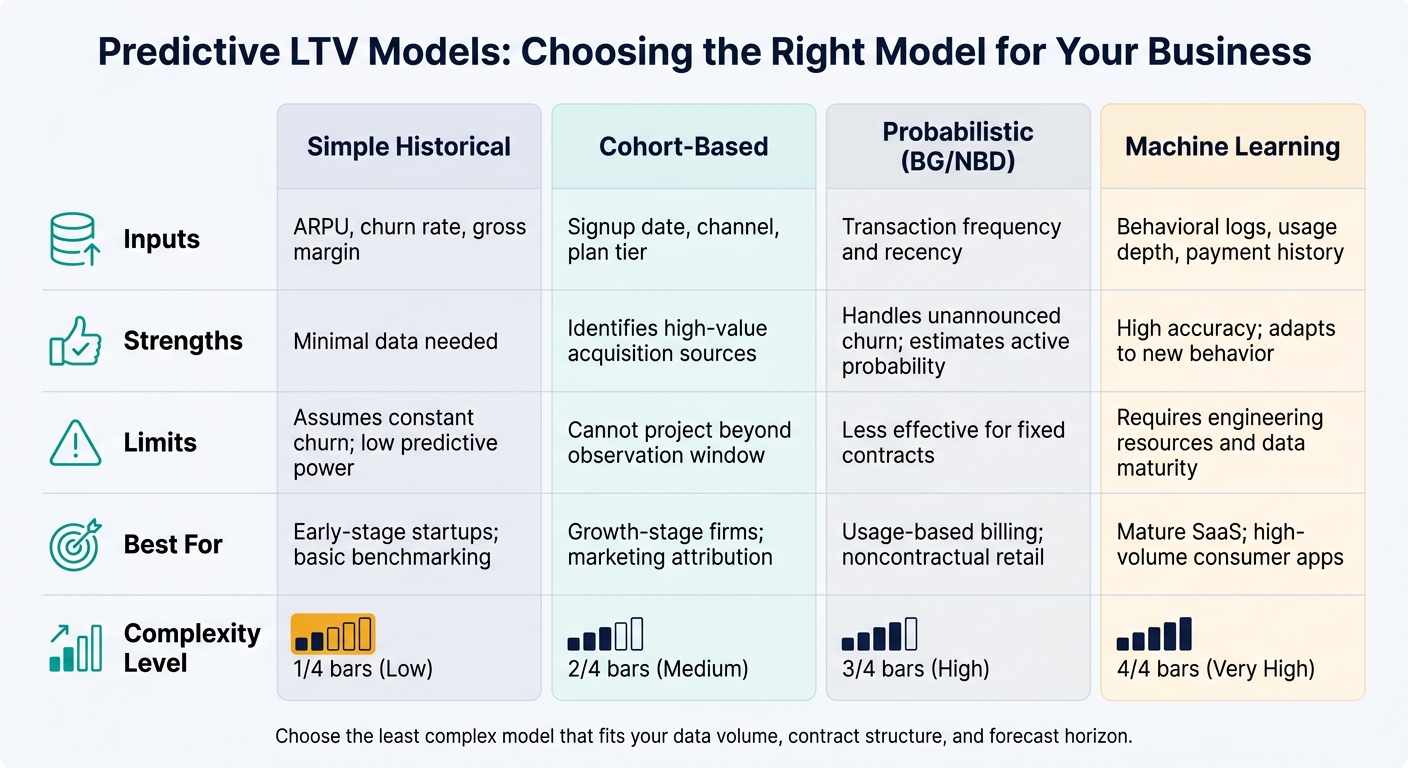
Predictive LTV Models: Choosing the Right Model for Your Business
Once behavior data is connected, the next move is simple: pick the least complicated model that still fits your data volume, contract setup, and forecast use.
That matters more than picking the fanciest option. The best model is the one that lines up with your data, your contract structure, and the time frame you're planning around.
A common place to start is RFM-style segmentation. It ranks customers by value and is easy to read, which makes it useful when teams need a clear way to sort accounts.
Cohort analysis is another early option. It groups customers by signup month or acquisition channel, so you can see which segments tend to drive the highest future value. That can be a big help when you're trying to figure out which channels bring in customers who stick around and spend more.
But cohort models have a limit: they can't project behavior past the observation window. So if you're working with a noncontractual business, like usage-based billing or retail, probabilistic models such as BG/NBD tend to fit better. BG/NBD uses recency and frequency of purchase behavior to estimate whether a customer is still active.
Once you've picked a model, the next job is figuring out which customers are healthy and which ones are already starting to slip.
Machine learning starts to make sense when there's enough data behind it. Without enough volume, it's overkill.
These models look at signals like:
Using that data, they rank customers into value segments and forecast revenue as new behavior comes in. One thing teams often miss: forecast margin, not just revenue. If you only look at revenue, low-margin customers can seem worth more than they actually are.
Before using any model for finance or leadership calls, back-test it against older cohorts. That's the gut check. If it doesn't hold up on past data, it shouldn't guide future decisions.
| Model Type | Inputs | Strengths | Limits | Use Cases |
|---|---|---|---|---|
| Simple Historical | ARPU, churn rate, gross margin | Minimal data needed | Assumes constant churn; low predictive power | Early-stage startups; basic benchmarking |
| Cohort-Based | Signup date, channel, plan tier | Identifies high-value acquisition sources | Cannot project beyond observation window | Growth-stage firms; marketing attribution |
| Probabilistic (BG/NBD) | Transaction frequency and recency | Handles unannounced churn; estimates active probability | Less effective for fixed contracts | Usage-based billing; noncontractual retail |
| Machine Learning | Behavioral logs, usage depth, payment history | High accuracy; adapts to new behavior | Requires engineering resources and data maturity | Mature SaaS; high-volume consumer apps |
That classification work sets up the next step: spotting the warning signs that pull future LTV down.
Use a small set of weekly or monthly signals to catch churn risk before revenue starts to slip. After the model is in place, these become the main indicators to watch between refreshes.
One quiet week doesn't tell you much. The pattern matters, and the right comparison point is each account's own baseline.
Flag accounts when:
Engagement velocity also matters. This is the week-over-week change in activity, like tasks completed or messages sent, and it's a strong churn signal [4].
A drop in velocity is a red flag, even if the account still looks active on the surface. On the flip side, rising velocity can be a good sign, even from a low starting point. These shifts shouldn't just sit in a dashboard. They should trigger a model update or some kind of outreach.
Billing signals usually show up later than usage signals, but they're much harder to wave away. If a customer moves from annual prepay to monthly billing, that's a strong sign they're less committed to the product [5][9].
Also watch for seat cuts, late renewals, shorter contract terms, and repeated failed payments. Billing alerts work best when paired with automated dunning [2][9].
Support data can add another layer. Rising ticket severity, more escalations, and resolution time running 25% or more above baseline all point to more churn risk - especially when usage is falling at the same time [8]. When these patterns show up together, they should feed straight into a model refresh or a retention trigger.
Keep the health score simple: 3–6 signals is enough. Pull one or two signals from usage, billing, support, and sentiment, then roll them into a 0–100 score or a tier system.
That score isn't just for customer success. It's a way to update future LTV estimates. If the score drops, the revenue forecast for that account should drop too.
| Risk Area | Example Metrics | Typical Lead Time Before Churn/Downgrade | Expected Impact on Future LTV |
|---|---|---|---|
| Usage | Weekly active users down ≥30% vs. 8-week baseline; core feature use down for 3+ weeks; session depth down ≥20%; workflow completion below trend | 4–12 weeks before renewal or downgrade | High: can cut projected LTV by 20–50% if sustained [4][10] |
| Billing/Contract | Declining order value; fewer repeat purchases; switch from annual to monthly; seat reductions; late renewals; failed payments | 1–3 billing cycles before churn | High: directly reduces realized revenue and is a strong negative adjustment to tenure assumptions [5][9] |
| Support | More high-severity tickets; more escalations; resolution time up ≥25% vs. baseline; low post-ticket CSAT | 4–16 weeks before renewal | Medium–High: accounts with persistent poor feedback have 20–50% lower realized LTV [6][8] |
| Sentiment | NPS decline; more detractors; negative stakeholder feedback; poor public reviews | 1–2 quarters before renewal | Medium: amplifies other risk signals and can trigger competitive evaluations [3][7] |
Give more weight to billing and contract changes than to small usage dips. Relative baselines matter too. A customer who now logs in twice a week but used to log in daily is in more trouble than a customer who has always logged in twice a week.
Refresh scores weekly or monthly, then connect each tier to clear actions: executive check-ins, targeted outreach, and automated dunning. Without actions tied to the score, it's just a number. The next step is to use those scores to update forecasts and shift budget decisions.
Once health scores start triggering action, those same behavior signals should also update revenue, cash flow, and budget assumptions. That’s when predictive LTV starts pulling its weight. It stops sitting inside a data science tool and starts shaping where the money goes.
Use customer-level LTV to forecast revenue and cash flow by cohort, segment, and product line. Feed predicted churn, expansion, and payment behavior straight into your forecast models. Finance teams can then turn accrual revenue into cash timing based on collections patterns, payment terms, and historical DSO (days sales outstanding). [12][13][15]
It also helps to model base, downside, and upside cases by adjusting churn and expansion assumptions for cohorts that look riskier or are starting to improve. [12][13][15] On top of that, apply seasonal multipliers to acquisition, churn, and expansion assumptions so forecasts reflect how the business actually moves over the year. [12][13][15]
Set CAC caps by segment using predicted LTV and your target LTV:CAC ratio. In most cases, that means aiming for 3:1 or better. [13][14][16][18]
Retention budgets follow the same playbook. High-LTV accounts with high risk can justify white-glove intervention. Lower-LTV accounts that show risk may be better served through scaled programs where marginal cost per user stays low. [11][13][16][17]
Product planning works the same way. If cohorts that activate two extra integrations show 30% higher LTV, that creates a clear case for putting money into integration UX and onboarding improvements. Those insights give product and engineering teams a direct way to tie roadmap choices to renewal rates, expansion revenue, and future LTV lift. [13][15]
Use LTV across three planning cadences:
| Planning Process | Time Horizon & Cadence | Key Behavioral Inputs | LTV Outputs Used | Primary Decisions |
|---|---|---|---|---|
| Annual Budget | 12–24 months, set once per year | Historical usage trends, renewal patterns, feature adoption, segment acquisition behavior | Segment-level LTV distributions, payback periods, cohort revenue curves | Revenue targets, total CAC budget, headcount, R&D investment envelopes |
| Rolling Forecast | 12–18 months, updated monthly or quarterly | Recent engagement changes, churn risk scores, pipeline conversion, support signals | Updated LTV by cohort, revised churn and expansion assumptions | In-year budget reallocations, updated revenue and cash flow guidance, hiring timing |
| Scenario Planning | 18–36 months, ad hoc or quarterly | Stress-tested behavior assumptions (usage decline, churn spikes, accelerated adoption) | Upside/base/downside LTV scenarios, tail risk and upside opportunity | Contingency plans, downside protection, investment pacing, fundraising timing and target sizing |
The key is to embed LTV in the core financial model, not treat it like a side analytics project. That keeps model updates, scenario planning, and budget decisions aligned as the business grows. Teams that don’t yet have the internal data setup or FP&A integration can bring in advisory support to connect those systems. [13]
Predictive LTV only works in the real world when the data is clean, connected, and tied to action. That starts with clean transaction data, unified customer IDs, and normalized revenue. Without that base, the forecast is just guesswork. The job here is simple: turn purchase, usage, retention, and service signals into a forecast that updates as customer behavior shifts.
Once the data is in good shape, use the simplest model that fits the business. Model complexity should match data maturity. Start with historical CLTV or cohort analysis. Then move to probabilistic models for noncontractual behavior. Machine learning makes sense for mature, high-volume teams, especially when churn doesn’t appear as a clear cancellation. In plain English, pick the model that fits how customers buy, renew, or quietly disappear.
It also helps to segment by plan, channel, or behavior before putting the model into planning. Then back-test it on past cohorts. That step matters. Back-testing is what makes the forecast solid enough for finance and growth planning.
From there, the forecasts need to flow into FP&A. That’s when predictive LTV starts doing actual work. It should inform budgeting, revenue forecasts, and cash flow planning, so LTV becomes a planning input instead of just an analytics output. When done well, predictive LTV turns customer behavior into clearer acquisition, retention, and product decisions.
Predictive Lifetime Value (LTV) models can be highly accurate. In some cases, advanced AI-powered systems can reach up to 90% accuracy when identifying customer outcomes.
But that level of accuracy doesn’t happen by accident. It depends on the quality of the data, how clean it is, and whether it’s connected across the business. When product, support, and commercial data live in one place, these models can forecast future value with more precision than historical averages alone.
That said, they’re not set-it-and-forget-it tools. Teams still need to check model performance over time and validate predictions against retention and churn.
Start by pulling data from systems like your CRM, billing platform, and support tools into one single source of truth. From there, standardize the format and make sure each record includes core identifiers, like unique customer IDs and clean transaction histories.
Numbers alone don’t tell the whole story. To fill in the gaps, add customer surveys or interviews so you can understand the reasons behind behavior patterns.
Update your predictive LTV model quarterly so it stays in step with market shifts, product changes, and changes in customer behavior.
It also helps to track performance monthly so you can spot trends early. If the business goes through a major change, retrain the model soon after. And for retention signals, check them weekly - or use daily live data queries when you need a closer read.