Published on
July 23, 2026


If your budget is already wrong by March, you need a live finance rhythm - not a year-old spreadsheet.
I’d sum the article up like this: in a shaky market, finance teams need 7 linked moves to stay close to cash, runway, hiring, and spend. The core idea is simple: use a rolling forecast, a 13-week cash view, 3 live scenarios, KPI alerts, connected source data, a weekly decision meeting, and a clean data stack to make decisions before month-end.
Here’s the short version:
What stood out to me is that this is not about more reports. It’s about a tighter loop between what changed, who owns it, and what action happens next.
A few numbers matter most:
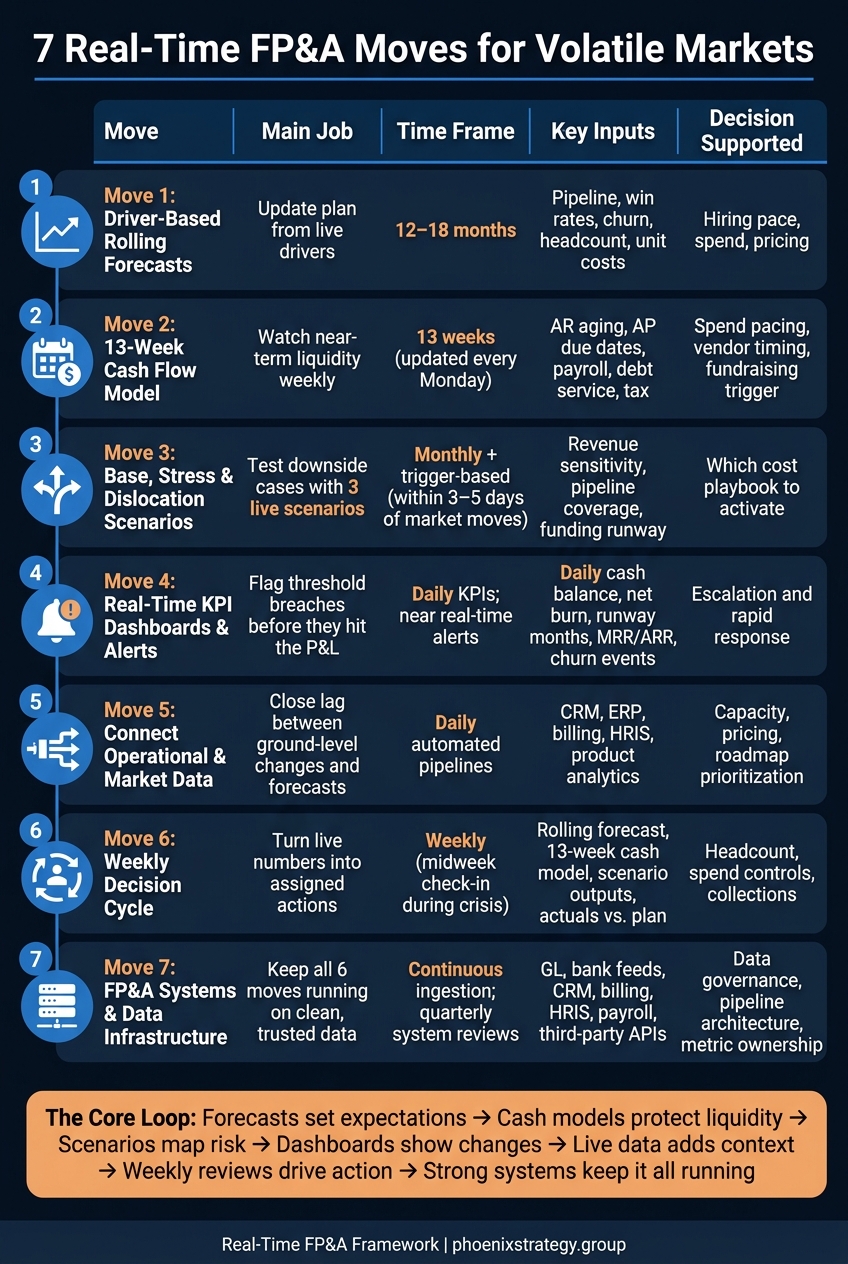
7 Real-Time FP&A Moves for Volatile Markets: A Complete Framework
| Move | Main job | Main time frame | Main decision |
|---|---|---|---|
| 1. Rolling forecast | Update plan from live drivers | 12–18 months | Hiring, spend, pricing |
| 2. 13-week cash model | Watch near-term cash | 13 weeks | Liquidity, payment timing |
| 3. Scenario planning | Test downside cases | Monthly + trigger-based | Cost actions, funding plan |
| 4. KPI alerts | Flag changes early | Daily to near real-time | Escalation and response |
| 5. Data connections | Keep inputs current | Daily to weekly | Forecast accuracy |
| 6. Weekly decision cycle | Turn numbers into action | Weekly | Headcount, spend, collections |
| 7. Systems and data stack | Keep all 6 moves working | Continuous + quarterly checks | Data ownership, model control |
My takeaway: real-time FP&A works when finance treats cash, forecast, and weekly decisions as one system. If you do that, you can spot a problem in time to slow hiring, trim spend, or change collections work before cash gets tight.
For U.S. growth-stage companies, a budget can get old fast. In a shaky market, demand, pricing, and costs can change in a matter of weeks. That’s common in SaaS, consumer, and tech-enabled services, where customer behavior shifts fast and competitors don’t sit still. So finance can’t just explain why results missed the plan after the month closes. The job is to keep updating the plan as the market moves.
Pricing, funding, and unit economics can change just as fast. Inflation, heavier discounting, and tighter capital markets all shape what customers can spend. At the same time, input, labor, and fulfillment costs can eat into margin even when revenue stays flat. That puts pressure on runway, hiring, and growth spend - the calls that matter most at this stage.
A static annual budget creates another problem: it locks teams into assumptions made months ago. When demand, pricing, or costs change, people start managing to the budget instead of managing to what’s happening in the business. That’s where things go sideways. What companies need is a plan that moves with the business, not one that waits for month-end variance reports to tell them what already happened.
Rolling forecasts solve for that. Instead of treating the annual plan like a fixed target, they treat it as a guide. Teams refresh assumptions monthly or even weekly using live drivers such as pipeline, conversion, churn, unit costs, and capacity. Move 1 starts with driver-based rolling forecasts.
A driver-based rolling forecast uses a small set of operating inputs - conversion, churn, ARPU, headcount, and DSO - to update revenue, expenses, and cash on its own. Unlike a fixed budget, it shifts when those drivers shift.
Use a 12–18 month horizon and move it forward every month. Pull in actuals from your GL, CRM, and billing systems monthly. For near-term drivers, update monthly. For pricing, hiring pace, and churn, do a quarterly reset. That cadence helps keep the forecast in step with fast market changes.
Keep the model lean at the start. Begin with 2–3 revenue drivers and 3–5 cost drivers. For most U.S. growth-stage companies, that usually means tracking leads and conversion rates on the revenue side, then headcount costs and a few key unit costs on the expense side. A handful of clean drivers beats a pile of noisy ones. If you add more before they tie back to actuals, you don't get clarity - you get clutter.
Ownership matters here. Finance owns the model and the update cadence. Sales, marketing, and HR own their inputs. Phoenix Strategy Group can help connect CRM, billing, and payroll feeds so the forecast stays current.
Once the forecast is live, shift your attention to weekly cash with a 13-week model.
Your rolling forecast covers the big picture. The 13-week cash flow model answers the near-term question: Do we have enough cash to run the business this week, next week, and the week after that?
It tracks actual cash receipts and payments across a rolling 13-week window, which means liquidity gaps can show up before month-end numbers do.
Update the model every Monday using bank and accounting actuals. Then look at variances to make better calls on hiring, spending, and collections. If things start moving fast - a churn spike, a delayed fundraise, or a major customer paying late - switch to daily updates.
The main inputs include:
The outputs that matter most are ending cash balance by week, minimum cash threshold, and projected runway in weeks.
This model is all about timing. If you spot a cash squeeze in Week 7 or Week 9, you still have time to act. You can cut back on discretionary spend, speed up collections, move vendor payments, or start lender talks before pressure limits your choices.
At growth-stage companies, this usually sits with the CFO or fractional CFO. That person sets the method and runs the weekly rhythm. AR, AP, payroll, and operations teams feed in the line-item data.
Phoenix Strategy Group can help pull banking, accounting, and billing data straight into the model. That cuts manual work and helps keep the forecast dependable from week to week.
Use that same weekly cash view to test base, stress, and dislocation scenarios.
In a shaky market, one forecast isn't enough. It's one plan, one path, and one point of failure. A better move is to keep three live scenarios running at all times, with each one tied straight to cash and runway.
The base case is your current operating plan. The stress case models a slowdown that's painful but still plausible, like slower pipeline conversion, churn rising by 50%, or collections slipping by 30 days. The severe dislocation case layers several shocks at once: a major customer loss, a funding freeze, CAC up 25%, and churn tripling. Each scenario should lead to a different management response, not just a different spreadsheet tab. [6][7]
Set clear refresh triggers. Watch key drivers like bookings, DSO, churn, and burn against trigger levels, then decide if your assumptions need to change. On a monthly basis, refresh the base case with new actuals and pressure-test the stress and dislocation cases. Each quarter, go deeper with reverse stress testing and a full 13-week cash check under every scenario. [3][5] The point of each refresh is simple: make a decision, not produce another report.
Every scenario should also translate into runway in months. That makes the tradeoffs plain. If one case cuts runway hard, you can preapprove a hiring pause, a spending freeze, or a financing plan before things get tight. [4][6]
This only works if each team updates its part of the picture:
Phoenix Strategy Group can help automate scenario updates with FP&A systems and data engineering.
Those thresholds feed the KPI alerts in the next move.
Those scenario thresholds from Move 3 only help if someone sees them shift in time to act. That’s where dashboards come in. They turn static thresholds into day-to-day signals.
Refresh each metric at the pace it can affect cash. Cash and revenue should update daily. Pipeline and spend can update hourly to daily. Simple rule: the faster a metric can change cash, the more often it should refresh. [8][9][12]
Start small. In most growth-stage companies, 5–7 core metrics is enough. A practical set includes:
Each one ties straight back to the cash model. So this isn’t dashboard wallpaper. It’s decision data. If net burn jumps from $400,000 to $600,000 per month, runway falls from 15 months to 10 months. That’s not just a number moving on a screen. It means finance may need to cut spend, slow hiring, or revisit funding plans. [9][10][12]
Alerts should also be tiered, so the right person responds at the right speed. [9][10][11]
| Alert Level | Example Trigger | Owner | Response Time |
|---|---|---|---|
| Informational | Pipeline coverage drops below 3.0x | FP&A Lead | Next weekly review |
| Action | Net cash burn exceeds plan by 15% | CFO + FP&A Lead | Within 48 hours |
| Critical | Forecasted runway falls below 6 months | CFO + FP&A Lead | Within 24–48 hours |
An alert is most useful when it points finance to the drivers behind the change. Otherwise, it’s just noise.
Each alert should spell out:
A good alert might say runway dropped from 11.2 to 8.9 months in the last 30 days, cash will fall below $2.0M on 11/15/2026, and the CFO and FP&A Lead should review it within 24–48 hours. It should also point to the next moves, like freezing non-critical hiring, cutting discretionary marketing by 15%, and updating funding scenarios. [9][10][11]
Once alerts are live, connect them to the operational and market data behind the move.
Live source data keeps forecasts and alerts up to date. The next move is simple: narrow those inputs to the few drivers that actually change revenue, margin, and cash.
Sync the sales pipeline daily, operations data daily to weekly, and market data daily when refreshing scenarios. That rhythm helps keep the 13-week cash model and the rolling forecast lined up with what’s happening right now.
Use a short driver catalog that explains most movement in revenue, margin, and cash. On the revenue side, that includes pipeline by stage → bookings, renewal rate → retained ARR, and net dollar retention → net expansion. On the cost side, it includes labor hours per unit, material cost per unit, freight cost per shipment, or cloud cost per active user flowing straight into COGS and operating expense lines. [15][13][14]
When live data updates those driver inputs on its own, the forecast shifts with it. No one has to rebuild the model by hand every time a number changes. That keeps the rolling forecast, cash model, and alerts in sync instead of pulling in different directions.
Feed CRM, ERP, billing, HRIS, and product analytics into a warehouse such as Snowflake or BigQuery. From there, standardized tables give FP&A one version of the numbers. That makes it easier to make faster calls on hiring, spend, pricing, and collections. Phoenix Strategy Group can help connect those systems through automated pipelines. With one data layer in place, FP&A can refresh decisions without manually rebuilding the model.
Ownership matters here. FP&A owns the driver map. Data engineering owns the pipelines. Sales, operations, and product own source-data accuracy. If that ownership gets fuzzy, stale inputs can drag down forecast quality fast. Clear lines of responsibility help keep live inputs dependable enough for weekly decisions.
Live dashboards and alerts are only half the job. Finance also needs a weekly decision cycle to turn movement into action.
This is usually a 30- to 60-minute meeting where finance and operators review live cash, forecast shifts, and KPI changes, then decide what happens next. The goal is simple: keep decisions moving instead of waiting for month-end.
Start with the biggest changes in cash and forecast. Put those on the table first. The 13-week cash model should be the core meeting pack: update actuals, roll forward Week 13, and review ending cash, variances, overdue collections, and the next cash low point. That’s what should drive the conversation, not last month’s income statement.
Then move to headcount. Payroll is often the largest fixed cost, and a few small hires that no one tracks can eat into runway fast. Each week, finance and leadership should look at open roles and ask a plain question: is this role tied to revenue right now, or is there a better move given current runway? In some cases, that means using a contractor. In others, it means shifting work internally. Put each hiring call in terms of tradeoffs: freeze, slow, or substitute.
The CFO or Head of FP&A should run the meeting and own the agenda and data. But business leaders need to own what happens after the meeting. Sales, operations, and people operations should be there when their calls can change spend or revenue. Delayed shipments, at-risk contracts, and shifts in vendor terms often don’t show up through finance alone. [16][2][17]
Wrap up each meeting with assigned actions, not loose discussion. A short decision log works well:
For example, the team might delay a hire, cut paid acquisition by 15%, and push a vendor payment by one month. [1][2][17]
Weekly decisions only work when the data stack is current and well governed. If data shows up late or different systems disagree, live decision-making falls apart. Real-time FP&A depends on a stack that keeps data clean, current, and trusted.
A durable FP&A stack has four layers: ERP/accounting, CRM/billing, HRIS/payroll, and FP&A/BI. Those systems should feed a cloud data warehouse through automated ELT. This setup is the base for Moves 1–6, not just a list of tools. FP&A models run on one current data set, which keeps the rolling forecast, cash model, and alerts from pulling in opposite directions. [18][19][22]
Once the stack is connected, ownership is what keeps it usable. Finance owns definitions and assumptions. Data engineering owns pipelines, schema, and quality rules. Put that ownership in a data-and-FP&A matrix so every metric has one accountable owner and a clear approval path for model changes. [20][21]
You also need a steady review rhythm. Check the stack each quarter for latency, failed refreshes, broken integrations, missing fields, and reconciliation breaks. During volatile periods, update assumptions weekly. The best stacks are modular and scalable, so it’s easier to add new products or geographies without starting over. That keeps weekly forecasts, alerts, and cash calls aligned as conditions shift. [20][21]
Phoenix Strategy Group helps growth-stage companies build integrated FP&A infrastructure across bookkeeping, fractional CFO, FP&A, and data engineering.
Each move works on a different part of real-time FP&A. Put them together, and you get a full decision system, not a loose set of tools. The table below gives you a fast way to check cadence, ownership, and decision scope.
| Move | Main Objective | Update Frequency | Key Data Inputs | Decisions It Supports |
|---|---|---|---|---|
| 1. Driver-Based Rolling Forecasts | Keep a live 12–18 month forecast tied to business drivers | Weekly driver checks; monthly forecast roll-forward | Sales pipeline, win rates, average deal size, churn, headcount, compensation bands, unit costs | Hiring pace, marketing spend, pricing or discount adjustments |
| 2. 13-Week Cash Flow Model | Maintain granular weekly liquidity visibility | Weekly without exception; twice weekly in acute stress | Cash balance, collections by invoice date, payroll, vendor payments, debt service, tax obligations | Spend pacing, vendor payment timing, fundraising trigger |
| 3. Base, Stress, and Dislocation Scenarios | Define and maintain three live scenarios | Monthly minimum; within 3–5 business days of material market moves | Revenue sensitivity, variable vs. fixed costs, pipeline coverage, funding runway, macro benchmarks | Which operating plan to follow, which cost playbook to activate |
| 4. Real-Time KPI Dashboards and Alerts | Surface threshold breaches before they hit the P&L | Daily KPIs; near real-time alerts; monthly configuration review | MRR/ARR, cash burn rate, net revenue retention, DSO, daily bookings | Rapid-response actions, leadership escalations |
| 5. Connect Operational and Market Data | Close the lag between on-the-ground changes and financial forecasts | Daily automated pipelines; same-day for high-exposure market data | Product telemetry, supply chain metrics, industry demand indices, CRM data | Capacity decisions, inventory policy, pricing, roadmap prioritization |
| 6. Weekly Decision Cycle | Replace ad hoc decisions with a structured, data-driven operating rhythm | Weekly meeting; midweek check-in during crisis conditions | Rolling forecast, 13-week cash model, scenario outputs, actuals vs. plan | Weekly priorities: growth moves vs. cost controls, tactical GTM and hiring directives |
| 7. FP&A Systems and Data Infrastructure | Build a durable, governed data stack that keeps all other moves running | Continuous ingestion; quarterly system reviews; annual roadmap | General ledger, bank feeds, CRM, billing, HRIS, payroll, third-party data APIs | Tool adoption, data governance rules, pipeline architecture, metric standardization |
Moves 1–6 all lean on Move 7. If the data is messy, stale, or hard to trust, everything else slows down and gets less precise.
The next failure mode is simple: these moves start to crack when teams use them one way one week and another way the next.
These weekly systems usually break for a simple reason: teams stop following the rules that make them work. In most cases, the problem isn’t the model. It’s the discipline around it.
Move 1 fails when teams track too many drivers. FP&A Trends research says that choosing too many drivers is the most common mistake in driver-based models.[23] More inputs do not mean better visibility. They often just add noise. Keep the drivers that materially change revenue, margin, or cash.
A simple way to handle this is with a driver hierarchy. In the real-time view, keep a driver only if a 5% to 10% shift in that driver materially changes monthly cash burn or runway. If it doesn’t move a key outcome, it probably doesn’t belong on the main screen.
Clean driver logic also falls apart when the source data is old or inconsistent. Move 4 fails when data is unreconciled. The 2025 AFP FP&A Benchmarking Survey found that 61% of FP&A professionals name lack of data reliability as their main challenge, while 60% say inaccessible data is a critical barrier.[24] Fast reporting sounds good, but speed without reconciliation gives teams false confidence.
Take cash as an example. A bank feed can overstate cash if it leaves out pending payroll or wires. That’s how teams walk into meetings with the wrong number and don’t know it yet. Each KPI needs:
Move 3 fails when alert thresholds are skipped. If no one has agreed in advance on what happens when cash runway moves into a yellow or red band, the team may notice the change but still have no duty to act. The number moves. Nothing happens. That’s not a warning system. That’s passive reporting.
Scenarios can go stale just as fast. They should be refreshed at least monthly, and more often when leading indicators start to shift. Otherwise, leadership may look at old scenario outputs and feel safer than they should.
Even when thresholds are set, things still fall apart if no one owns the response. Move 7 fails when ownership gaps go unaddressed. If nobody is clearly named as the owner of a KPI or scenario set, definitions start to drift, formulas get changed, and alerts stop carrying weight. The fix is simple: use a basic RACI with one owner for data and one owner for action. Without that, real-time FP&A turns into reporting instead of decision-making.
Real-time value depends on clean data, clear ownership, and specific action.
These seven moves do the most good when they run together as one system, not as seven separate tools.
Here’s the loop: forecasts set expectations, cash models protect liquidity, scenarios map risk, dashboards show changes, live data gives those changes context, weekly reviews push action, and strong systems keep the whole thing dependable.
For example, a team watching daily net cash burn and weekly ARR can slow hiring this week during the weekly review if the 13-week forecast points to a $2.5 million shortfall by October 15.
In volatile markets, slow decisions eat into runway. When forecasts, scenarios, alerts, and weekly decisions are tied together, finance stops being just a reporting function and starts acting like a decision engine. That’s the real edge of real-time FP&A: faster decisions when markets move.
Phoenix Strategy Group helps growth-stage companies turn live financial data into decisions that protect runway, improve efficiency, and support the next stage of growth.
Start with a phased approach that focuses on the data with the biggest impact, not on piling on complexity. Look at your accounting, payment, and CRM tools first. That’s usually where manual work gums up reporting and slows decisions.
Then keep it simple:
Prioritize the metrics that have the biggest impact on liquidity and your near-term goals. Start with daily cash balance, burn rate, and runway. Those three give you a plain-English view of financial stability.
Then add leading indicators like customer acquisition cost, churn, and pipeline velocity. These metrics can show shifts early, before they hit cash.
Use real-time dashboards with clear thresholds so your team can spot anomalies fast, test scenarios, and make decisions with less guesswork.
Effective weekly FP&A ownership starts with clear roles and simple governance. One person should own metric definitions. Another should oversee the data pipeline so reporting stays consistent from week to week.
Controllers handle transaction-level data. AR and AP managers manage collections and payments. If your team is stretched thin, Phoenix Strategy Group can step in with fractional CFO and FP&A support.