Published on
July 27, 2026


If I had to boil this down to one point, it’s this: SaaS finance works better when I watch a small set of KPIs every week, define them one way, and tie alerts to pricing, hiring, and cash decisions.
Month-end reports are too late for most SaaS teams. If MRR, NRR, CAC payback, burn multiple, and runway shift, I want to see it now, not after the quarter ends. A dashboard only helps if the data lines up across billing, CRM, accounting, and cash balances.
Here’s the short version:
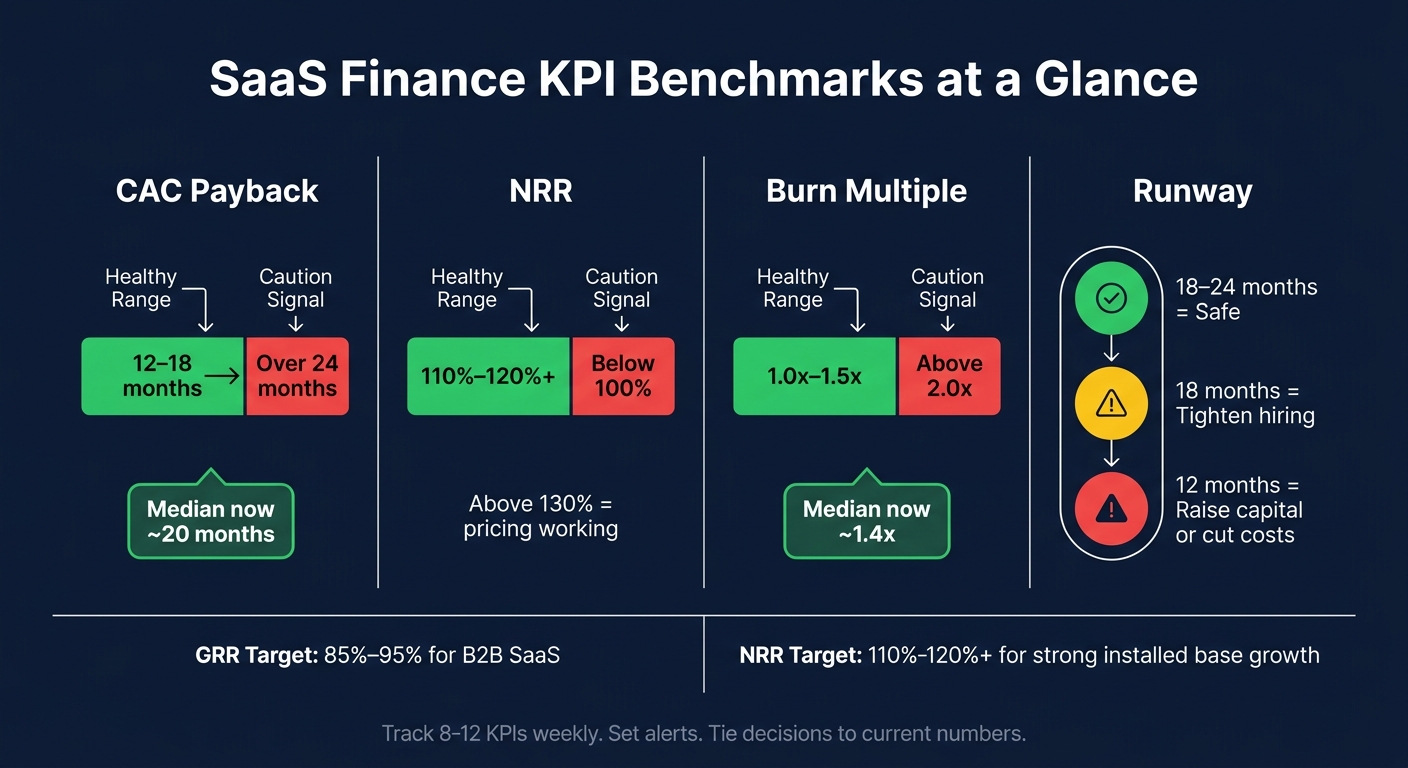
A few numbers stand out. Many B2B SaaS teams aim for GRR of 85%–95%, NRR above 110%–120%, CAC payback of 12–18 months, and burn multiple around 1.0x–1.5x. In newer market data, median CAC payback has moved closer to 20 months, and median burn multiple sits near 1.4x.
| KPI area | What I’m watching | What it tells me |
|---|---|---|
| Revenue | MRR, ARR, churn, NRR | Is growth holding up? |
| Sales efficiency | CAC, CAC payback | Am I spending too much to win customers? |
| Cash | Burn, burn multiple, runway | How much time do I have? |
| Alerts | Threshold and trend alerts | When do I need to act? |
My takeaway: I don’t need more dashboards. I need clean definitions, shared numbers, and alerts tied to decisions.
Below, I’ll sum up the article in plain English without repeating it line by line.
These KPIs tell you three things fast: the quality of your revenue, how much it costs to win growth, and how much cash pressure the business is under. Start here if you want to know whether growth is real, efficient, and built to last.
Monthly Recurring Revenue (MRR) is recurring subscription revenue recognized in a month. It does not include one-time fees or non-recurring usage charges.
MRR = Σ (Monthly subscription price per customer × number of active customers on recurring plans)
One MRR number alone doesn't tell the full story. Finance teams usually split it into four parts:
When you track these in a monthly MRR bridge - starting MRR → new → expansion → contraction → churned → ending MRR - you can see where growth comes from and where revenue is slipping away.[17][18]
ARR is the annualized value of recurring contracts, usually calculated at the end of the month and reported in U.S. dollars. The basic formula is simple: ARR = MRR × 12. Teams often use ARR to gauge scale, and $1,000,000 ARR is a common U.S. Series A marker.[5]
Churn can point to very different risks depending on how you measure it. Customer churn tracks lost logos. Revenue churn tracks lost dollars. That matters because a company might lose a lot of small accounts and barely feel it in revenue.[15][19]
Gross Revenue Retention (GRR) and Net Revenue Retention (NRR) show how steady your current revenue base is. GRR leaves out expansion, so it can never go above 100%:
GRR = [(Starting MRR − Churned MRR − Contraction MRR) ÷ Starting MRR] × 100%
NRR adds expansion back in:
NRR = [(Starting MRR − Churned MRR − Contraction MRR + Expansion MRR) ÷ Starting MRR] × 100%
If NRR is above 100%, current customers are growing faster than they are shrinking. That's a strong sign for the installed base.[11][1] In B2B SaaS, strong companies often aim for GRR of 85–95% and NRR above 110–120%.[9][10]
These revenue metrics give you the base layer for looking at acquisition efficiency and cash planning.
CAC includes the sales and marketing spend, tools, and allocated overhead needed to win one customer.
CAC = Total Sales & Marketing expenses in period ÷ New customers acquired in that period
Here's where a lot of teams get tripped up: a blended CAC can hide a mess. SMB, mid-market, and enterprise customers don't cost the same to acquire. Enterprise deals usually come with longer sales cycles and higher costs, so rolling everything into one average can blur where the business works and where it doesn't.[14][16]
CAC payback turns that spend into a timeline:
Monthly contribution margin per customer = Monthly recurring revenue per customer − COGS attributable to that customer CAC payback (months) = CAC ÷ Monthly contribution margin per customer
Say average CAC is $3,600 and monthly contribution margin per customer is $300. Payback is 12 months. That's the kind of math boards look for. At Series B and beyond, boards often expect 12–18 months, while product-led models are usually pushed to pay back faster.[14][15][5] They also review CAC payback next to NRR and burn to judge whether growth is using capital well.
That lens gets even sharper once you pair it with burn and runway.
Gross burn is monthly operating cash outflow. Net burn backs out customer collections. Burn multiple is net burn ÷ net new ARR. Runway is cash on hand ÷ net monthly burn.[12][13]
Net burn = Gross burn − Customer collections
Burn multiple = Net burn ÷ Net new ARR in the same period
Runway = Cash on hand ÷ Net monthly burn
Burn multiple is one of those metrics that cuts through the noise. Common benchmarks are:
In board meetings, finance leaders usually show runway in three versions: current burn, a planned hiring case, and flat headcount. That gives the board a plain view of the tradeoff between growth speed and financial risk. In the U.S., companies often start fundraising with 9–12 months of runway left, which gives enough time for diligence.[12][13][14]
Once your KPI definitions are locked in, the dashboard should be built around the decisions your team needs to make.
Start by organizing KPIs based on the choices they inform. For a weekly leadership dashboard, keep it tight: 8–12 KPIs is usually enough. Group them into four areas: revenue growth, retention, unit economics, and cash.[3][24]
Each group should answer one clear question.
That setup keeps the dashboard from turning into a wall of numbers. It also helps leaders get to the point fast.
After that, tie every metric to one source of truth. A SaaS finance dashboard usually pulls from four systems.
Your billing or subscription platform should own MRR, ARR, and churn data. That includes subscription status, plan IDs, cancellations, and invoices. Your CRM should supply new customer counts, opportunity close dates, and segment tags like SMB or enterprise. Those inputs matter when you're calculating CAC by channel and cohort. Your general ledger should provide sales and marketing spend for CAC, plus gross margin and operating costs for burn. And your bank feeds should show the actual daily cash balance used for runway.[2][21][22][23]
This matters because teams get into trouble when each one reports a different version of the same KPI. Finance says one thing, sales says another, and suddenly no one trusts the dashboard.
The fix is simple in theory: sync all four systems automatically. If a subscription changes, that update should hit your data warehouse within minutes and refresh MRR on its own.
Next, shape the dashboard around who will use it. Finance needs detail. Founders need speed and early warning signs. The board needs trends and outcomes.
The layout should follow the way leaders scan a page. Put the highest-risk items at the top. That usually means cash balance and runway in large tiles, with simple color signals for safe, watch, and risk. Right beside them, show monthly burn and burn multiple so the team can see the tradeoff between growth pace and cash pressure in one glance.[20][22]
In the middle section, use an MRR waterfall by month. Show starting MRR, new, expansion, contraction, churned, and ending MRR. This makes it easy to spot where growth is coming from - and where revenue is leaking quietly in the background.
For retention, add a churn cohort table grouped by customer start month or by segment, such as SMB, mid-market, and enterprise. Also include a budget-versus-actual trend line for ARR and burn in every version of the dashboard. That's one of those views people come back to again and again because it shows whether the plan is holding up.
The board view should strip out line-item detail and focus only on the metrics the board cares about most: ARR, growth rate, NRR, CAC payback, burn multiple, and runway. Add trend lines so the board can see direction, not just a single-month snapshot.[24][21]
Keep finance drill-downs in a separate layer. That includes things like channel-level CAC, department-level burn variance, and gross margin trend. If everything is shown in one place, the dashboard gets noisy fast. Separate layers keep the top view clean while still giving finance the detail it needs.
Alerts turn dashboard data into action. When a metric crosses a line or starts moving the wrong way, the right people hear about it right away - not weeks later during monthly close or quarterly board prep.
Two alert types matter most here. Threshold-based alerts fire when a metric passes a set level, like churn rate going above 3% in a rolling 30-day window or CAC payback stretching past 24 months. Trend-based alerts flag movement before it turns into a bigger issue, like NRR dropping by more than 3 percentage points week over week or burn multiple getting worse for three straight weeks even when revenue stays flat.[27][3]
Start with cohort-specific alerts. That matters because pricing changes usually hit only part of the customer base. If you watch company-wide averages, you can miss the signal.
A practical setup for a pricing change looks like this:
Cohort-level NRR is another metric to watch closely. If it drops below 110–120% after a pricing change, that's a retention risk that needs fast attention. If it climbs above 130%, the new pricing model is doing its job and may be worth rolling out to more of the base.[3]
Alerts should connect to operating decisions, not sit in finance review and go nowhere. The same logic should guide hiring and spending.
One of the most useful setups ties burn multiple straight to headcount approval. Set a target burn multiple - often 1–2× for efficient growth - and trigger an alert when it stays above that range for two or more straight months, or jumps above 3×.[25][3] Pair that with a net burn alert when actual spend runs more than 10–15% above budget across a rolling 60-day window. That helps catch steady overspend, not just one-off spikes.
For runway, a tiered floor works better than one alarm. A common setup for U.S. venture-backed SaaS companies is:
Once runway drops into the 18-month range, non-critical roles should need CFO sign-off. At 12 months, open offers and upcoming start dates should be reviewed right away.
Board meetings happen every quarter. The metrics the board cares about move every week. Real-time monitoring closes that gap.
For each core board metric, set an internal alert against the same target the board already tracks. If ARR growth falls below the quarter's pacing curve, finance can flag it early and shift sales and marketing activity before the quarter ends - not after. If NRR drops below 110–115%, that's something to surface to the board early, not tuck away in a footnote.[29][30] If CAC payback moves past 24 months, the board will ask about go-to-market efficiency, and the alert means your team already has the answer lined up.[3][28]
Alert-triggered metrics should match board deck metrics exactly. That way, finance isn't stuck reconciling two versions of the truth. Standardize ARR, NRR, CAC payback, burn multiple, and runway with the same definitions and time frames, then export them straight into board materials. It keeps reporting clean and easy to trust.[30][31]
Next, build the KPI infrastructure, data definitions, and forecast process that keep these alerts accurate.
SaaS Finance KPI Benchmarks: Healthy Ranges vs. Caution Signals
Alerts are only as good as the data behind them. If the numbers are messy, the alerts will be too.
That starts with clean, accrual-based bookkeeping. Subscription revenue should be recognized across the life of the contract, not only when the invoice gets paid. That one practice shapes how you calculate MRR, ARR, churn, and NRR. From there, the path is pretty simple: clean books, accrual reporting, a fast close, a dashboard people trust, and then forecasting.[34][35][36]
A dependable monthly close should happen within 5–10 business days. Before anything goes to the board, finance should reconcile cash, AR, payroll, deferred revenue, and vendor spend. Some growth-stage companies move to a weekly accounting rhythm to shorten the month-end close and keep operating metrics up to date between closes. Phoenix Strategy Group supports growth-stage SaaS companies with bookkeeping, FP&A, data engineering, and fractional CFO work to put this system in place.[34][35]
Once your data pipeline is in good shape, benchmarks help you tell the difference between normal movement and an actual problem.
The key thing to remember is that benchmarks are context, not hard rules. Company stage, average contract value, and go-to-market motion all shape what “healthy” looks like. For U.S. growth-stage SaaS, investors and operators often use the ranges below as reference points. They’re useful for spotting when pricing, hiring, or fundraising may need a second look, not for setting rigid targets.[6][32][33]
| Metric | Healthy Range | Caution Signal |
|---|---|---|
| CAC Payback | 12–18 months | Over 24 months |
| NRR | 110%–120%+ | Below 100% |
| Burn Multiple | 1.0–1.5x | Above 2.0x |
| Runway | 18–24 months | Under 12 months |
There’s also been an important market shift. Median CAC payback has stretched to about 20 months in recent cohorts, versus the older 12–14 month rule of thumb. Median burn multiple is now around 1.4x.[7][8] That change points to a broader focus on capital efficiency instead of growth at any cost.
Before you change pricing, add a sales pod, or start a fundraising process, look at at least 6–12 months of KPI trends. One rough month doesn’t always mean the business has a deep issue. Maybe a large logo churned. Maybe a marketing test pushed CAC up for a short stretch. Rolling averages and cohort views make it easier to spot the signal and ignore the noise.[8][32][33]
A small set of clearly defined KPIs, connected systems, and role-based dashboards gives founders and finance teams the visibility to move faster and make better calls. It helps close the gap between board meetings, cuts down on overreacting to short-term swings, and ties pricing, hiring, and cash decisions to current numbers instead of month-old snapshots.
Start with MRR as your main sign of business momentum. If you're running an early-stage company, keep a close eye on cash burn, runway, and customer counts too. Those numbers help you see whether the business is staying steady while you grow.
As the company gets bigger, bring in efficiency and retention metrics like CAC payback period, churn rate, and NRR. MRR tells you what has already happened. To get a better read on what's happening right now, pair it with leading indicators like pipeline velocity and churn. That mix gives you a clearer view of financial health.
Update your KPI dashboard based on how fast decisions need to happen and how much the metric tends to move. A tiered setup usually works best.
Refresh operational panels and high-volume metrics, like cash balance, churn alerts, and daily bookings, every 5 to 15 minutes or daily. Update core financial metrics like MRR and ARR daily. Then review longer-term indicators like NRR, GRR, CAC, and cohort analysis monthly, quarterly, or annually.
KPI alerts should spark action when a metric slips outside an acceptable range or crosses a set threshold.
Use the “So What?” test for every KPI. If a change wouldn’t lead to an immediate decision or at least a serious discussion, it doesn’t belong on the dashboard.
Not every metric needs the same level of urgency, either. Critical KPIs should have tight thresholds so teams can act right away. Less urgent metrics can use broader thresholds and stay in periodic reports instead of demanding instant attention.