Published on
August 13, 2026


A higher MRR number does not always mean your SaaS business is getting stronger. I look at four signals first: MRR/ARR trend, new vs. lost revenue mix, NRR, and data accuracy.
Here’s the short version:
A simple way to read the dashboard each month:
If I can’t read those signals in under 30 seconds, the dashboard needs work, or you may need a fractional CFO to clean up the reporting.
Start with the top-line recurring revenue chart. It gives you the fastest read on whether revenue is compounding or starting to stall. Track current MRR, current ARR, month-over-month (MoM) growth, and a 12-month trend line. Once those numbers are in place, look at the shape of the line.
For monthly plans, ARR = MRR × 12. For annual contracts, annualize the contracted recurring revenue, not the cash collected or the invoices sent. So if you close a $12,000 annual deal, record it as $1,000 MRR instead of showing a $12,000 spike in the month it closes. [7][8][9][12]
Your summary panel should include current MRR, current ARR, last month’s MoM growth, and a 3-month rolling average. That rolling average helps smooth out short-term noise, which makes it easier to see whether momentum is holding up or if one strong month is fooling you. [5][13]
The shape of the MRR line often tells you more than the raw number. Three patterns matter most:
When growth starts to flatten, split the line into new revenue, expansion, contraction, and churn.
Bad signals usually come from messy MRR definitions. The big mistake is mixing in setup fees, implementation charges, or usage-based overages that aren’t recurring under contract. MRR should reflect normalized subscription revenue only. [9][11]
Also, record MRR net of discounts, not at list price. If a promo drives a wave of signups, your MRR line should reflect the revenue you’re actually getting. Not the sticker price. When teams mix those inputs, the chart can show fake jumps that push hiring or spending decisions in the wrong direction. [9][10]
A clean top-line chart only works if each revenue driver is tracked separately.
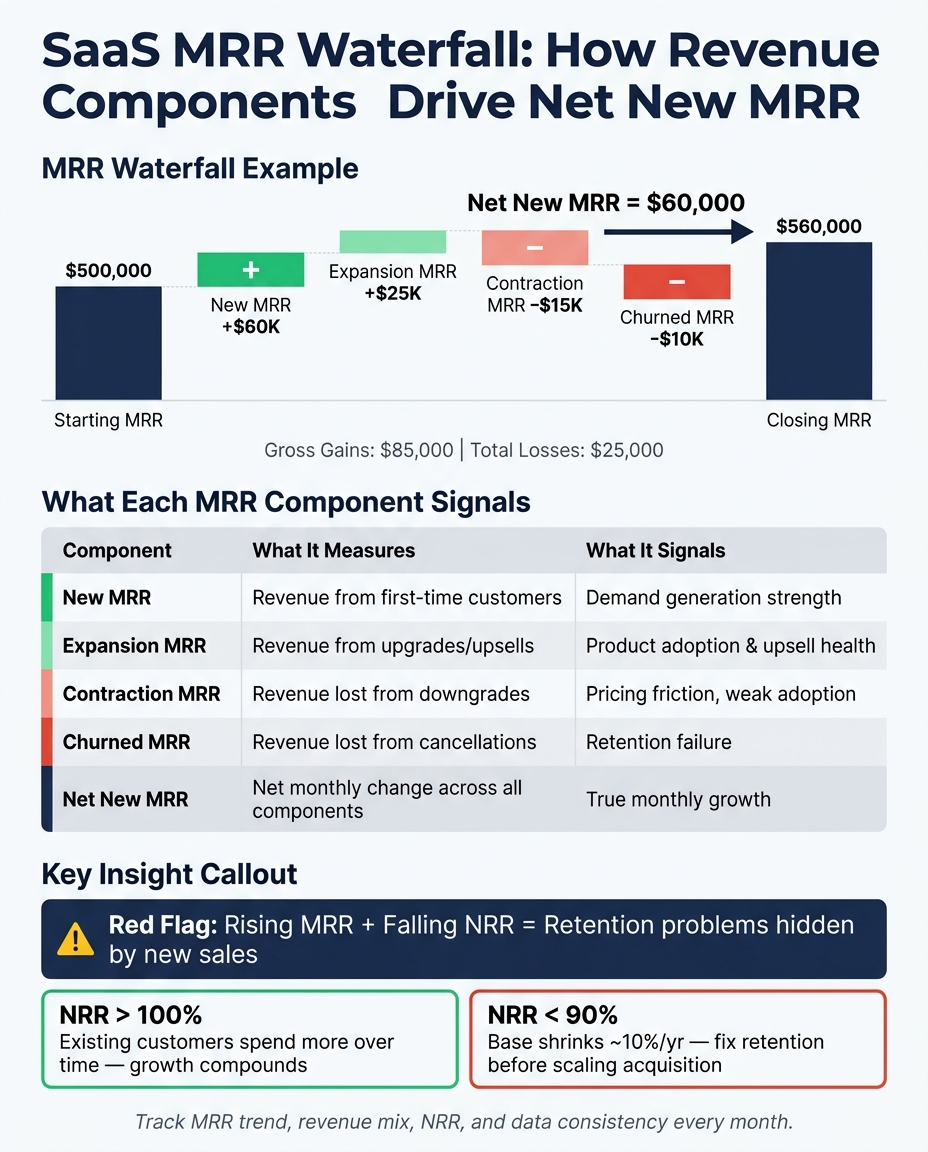
SaaS MRR Waterfall: How Revenue Components Drive Net New MRR
Use the waterfall to tie every MRR move to a source. Start with opening MRR, add New MRR and Expansion MRR, subtract Contraction MRR and Churned MRR, and you land on closing MRR. Add the first two, subtract the last two, and you get Net New MRR - the clearest single number for actual monthly growth. [14][15][17]
Here’s a simple example. If a company starts with $500,000 MRR, adds $60,000 in new MRR and $25,000 in expansion, then loses $15,000 to contraction and $10,000 to churn, it finishes at $560,000 MRR with $60,000 in net new MRR. Gross gains of $85,000 were reduced by $25,000 in losses. [14][18][19]
This breakdown matters when the top-line chart stops telling the whole story. A rising MRR line can look good on the surface, but it doesn’t show how that growth is happening. That’s why it helps to track each piece on its own and see whether the business is building growth or just patching leaks.
| Component | What it measures | What it signals |
|---|---|---|
| New MRR | Revenue from first-time customers added in the period | Demand generation strength |
| Expansion MRR | Additional recurring revenue from existing customers upgrading, adding seats, or increasing usage | Product adoption and upsell health |
| Contraction MRR | Revenue lost from downgrades or reduced usage without a full cancellation | Pricing friction, weak feature adoption, poor fit |
| Churned MRR | Revenue lost from customers that fully cancel | Retention failure |
| Net New MRR | Net monthly change after all components | True monthly growth |
Strong New MRR paired with weak Expansion MRR usually points to acquisition-led growth. That can work for a while, but it doesn’t tend to compound well as a company gets bigger. [2][7]
Rising Contraction MRR often shows up before churn. In plain English, customers start pulling back before they leave. That usually points to pricing friction, weak adoption, or poor fit. If you segment contraction by cohort, plan, and acquisition channel, you can often spot exactly where the problem is piling up. [2][16]
Headline MRR can keep going up even while the mix underneath gets worse. Strong new customer acquisition can outrun rising churn and contraction for a while, which makes the business look fine right up until the cracks get too big to hide. [14][2][17]
That’s why one month of Net New MRR doesn’t tell you much on its own. The multi-month trend is what matters. If net new growth is slowing while total MRR still climbs, the company may be working harder just to stay in place. Customer acquisition costs may be going up, expansion may be softening, and retention issues may be eating into future growth before they show up on the main revenue chart. [14][17][19]
Recurring revenue health is about composition, not just size. Two SaaS companies can post the same growth rate and still look completely different underneath. One may have a balanced mix of new revenue, expansion, and low churn. The other may be covering up retention problems with heavy acquisition. [14][2][17]
Use the waterfall to show where growth comes from; NRR shows whether that growth can hold up.
Once you’ve broken MRR into its main drivers, NRR helps you see what’s happening inside your current customer base.
Net revenue retention, or NRR, measures how much recurring revenue you keep and grow from existing customers over a set period, without counting new customers. Gross revenue retention, or GRR, looks only at retention. It leaves out expansion revenue. So while GRR shows how much revenue you kept, NRR shows whether retention plus expansion is turning your current base into a growth engine.
Here’s the formula:
NRR = (Starting recurring revenue + expansion − contraction − churn) ÷ starting recurring revenue × 100. GRR uses the same formula without expansion.
Put simply, NRR tells you whether revenue from current customers is building over time or slowly slipping away.
When NRR is above 100%, expansion covers all downgrades and churn and still adds net growth on top [21][22][1][20][23][24]. That’s a strong sign. Your current customers are spending more over time, even before you bring in a single new account.
For example, if you start with $1,000,000 in ARR and post 115% NRR, that same customer base would produce $1,150,000 the next year without adding any new logos [21][24].
When NRR falls below 100%, the picture changes. Your current base is shrinking, and growth starts depending more on new logos [21][22][20][24]. At 90% NRR, the existing base shrinks by about 10% per year. At that point, it usually makes more sense to focus on:
...before pouring more money into acquisition [21][22][20][24].
Rising MRR with falling NRR is a red flag. It means the business is leaning harder on new logos while the current customer base gets weaker [21][22][20][24].
A churn spike often points to onboarding issues, support problems, or a product change that reduced the value customers get. Persistent contraction tends to point somewhere else: pricing or packaging is off. In that case, customers may still like the product, but not enough to stay on their current plan.
That’s why it helps to segment NRR instead of treating the whole base like one big blur. Look at it by:
This makes it easier to spot where the problem is concentrated [3][25][26][27].
Those trends help founders decide where to act next: push harder on acquisition, fix retention, or rework pricing and packaging.
A dashboard only matters if it changes what you do next.
Use the pattern to decide where to act: acquisition, retention, pricing, or product.
| Metric pattern (3–6 month trend) | Likely causes | Immediate checks | Recommended actions |
|---|---|---|---|
| Flattening MRR with low churn; NRR ~100%–105% | Acquisition not scaling; sales efficiency falling | Lead volume and conversion by channel; win rates and CAC trends by segment | Narrow ICP; shift spend to the highest-ROI channels; adjust quota or sales capacity |
| Rising churn and contraction; NRR drifting below 100% | Poor onboarding; product-market fit gaps; pricing mismatch | Churn by cohort, plan, and segment; product usage before churn events | Fix onboarding; prioritize roadmap items tied to top churn reasons; revisit pricing tiers |
| Strong new business, weak expansion; NRR ~95%–105% | Limited upsell paths; customer success focused on support, not growth | Expansion MRR share of total; upgrade events; CS playbooks and incentives | Add upsell capacity; build upsell playbooks; redesign plans for clear upgrade ladders |
| High NRR (>120%), moderate new logo growth | Strong customer value; under-invested in acquisition | NRR by cohort; marketing and sales funnel capacity | Increase acquisition investment with disciplined CAC targets; expand into adjacent segments |
| Volatile net new MRR; inconsistent definitions | Data hygiene issues; lumpy enterprise deals; manual processes | Standardize KPI definitions; reconcile billing, CRM, and GL data | Standardize definitions; automate data pipelines; separate one-off deals from underlying trends |
The most dangerous setup is rising MRR with falling NRR. On the surface, the business can still look healthy. But that top-line growth can hide retention trouble underneath.
That’s why the third row deserves extra attention. MRR can keep moving up while NRR slips below 100%, which means the customer base is quietly getting weaker. It’s a bit like seeing more money come in each month while the bucket has started to leak.
Once you spot a pattern, first check whether the issue is real or whether the data is off. Phoenix Strategy Group helps growth-stage SaaS teams standardize KPI definitions and build automated recurring revenue dashboards.
In practice, founders should track four signals: MRR/ARR trend, revenue mix, NRR, and data consistency.
Start with your MRR and ARR trend lines to see where the business is heading. Then split that top line into new revenue, expansion, contraction, and churn so you can see why it’s moving. Use NRR to tell whether your current customer base is getting stronger or weaker over time. Then connect each pattern to a clear decision, like pricing, retention spend, sales capacity, or the product roadmap.
A useful benchmark: the dashboard should be readable in under 30 seconds[28].
MRR is the monthly revenue you can count on from active subscribers.
To calculate it, add up the monthly subscription fees from every active plan.
This should include recurring subscription charges and contract-based add-ons, like per-seat fees or recurring premium support. If a customer is on an annual contract, divide the full contract value by 12 to get the monthly amount.
Leave out one-time charges, including setup, onboarding, implementation, professional services, and non-recurring usage fees or overages.
Churn measures revenue you lose when customers cancel or move to a lower-priced plan. NRR looks at the bigger picture because it also includes the revenue you gain from current customers.
It starts with your current revenue base, subtracts churn and contraction, then adds expansion, upsells, and cross-sells. If NRR is above 100%, revenue growth from current customers is more than enough to cover those losses.
Founders should pay attention when MRR is going up but the numbers underneath it tell a messier story. A higher topline can look good at a glance, yet it can also hide weak or short-lived growth.
The fix is simple: look at the mix behind the MRR. Review new MRR, expansion MRR, churn MRR, and contraction MRR side by side. That gives you a clearer read on whether growth is healthy or whether gains are masking trouble.
It also helps to dig deeper when growth seems tied to problems like:
A business can post higher MRR and still be heading into a rough patch if those drivers keep moving in the wrong direction.