Published on
July 31, 2026

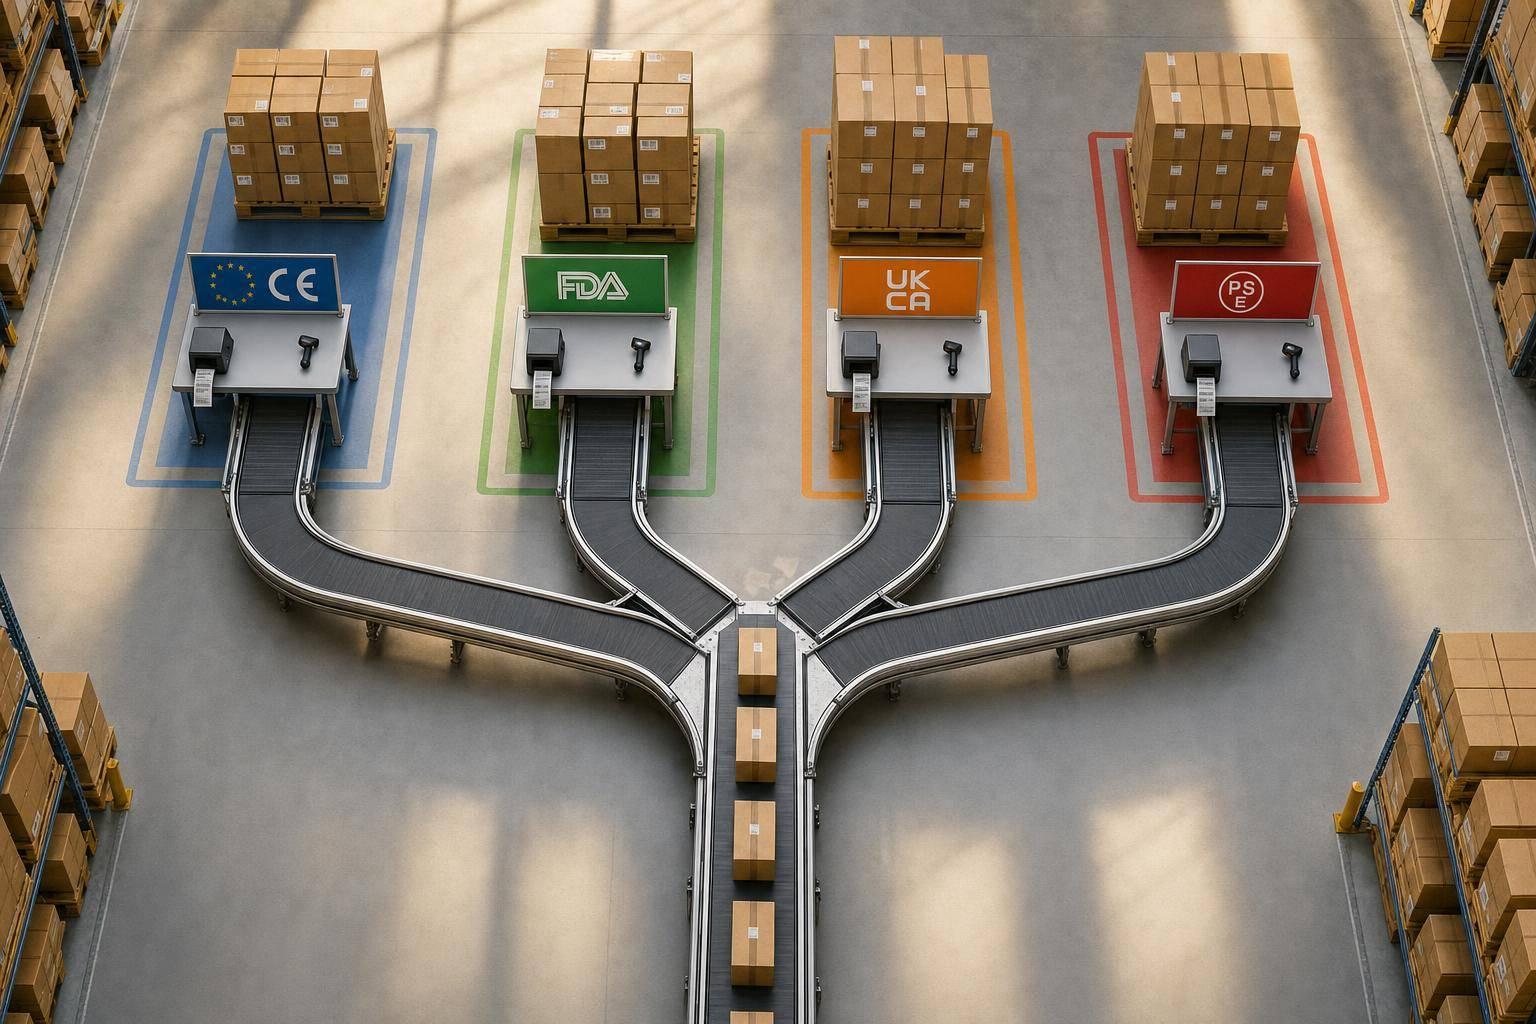
More revenue does not always mean more profit. If each new market needs its own testing, labels, paperwork, and product changes, scale can stop helping and start hurting.
Here’s the short version: I’d treat expansion as a margin test, not a sales test. The article’s main point is simple:
A few numbers make the point fast:
| Decision | Margin upside | Margin risk | Best use case |
|---|---|---|---|
| Global SKUs | Lower unit cost, longer runs, fewer changeovers | May block entry where local rules differ | Markets with similar product and labeling rules |
| Localized SKUs | Better market fit, possible price support | Lower batch efficiency, more inventory, more overhead | Markets where extra sales cover added cost |
| Centralized compliance | Lower fixed cost per market added | Slower response if team is thin | Early and mid-stage expansion |
| Regional compliance | Better local regulator coverage | Duplicate staff and systems | Higher-volume regions |
| Single-plant model | Higher utilization, lower overhead per unit | More exposure to disruption and distance | When one site can serve many markets well |
| Multi-plant model | Local production and shorter delivery paths | Duplicate validation and site costs | When regional volume is high or local rules push production there |
If I were making the call, I’d model SKU count, testing cost, approval time, working capital, and plant utilization before entering any new market. That tells me whether growth is adding profit - or just adding work.
Regulatory divergence rarely wrecks margin all at once. It chips away at it over time.
The pressure builds across three cost buckets, and each one adds overhead as a company moves into more markets. Bit by bit, one compliance system turns into several.
Information costs cover the work of keeping up with the rules. That means tracking rule changes, reading guidance documents, and keeping compliance records in shape across jurisdictions. When rules are hard to follow or open to interpretation, these costs climb fast.
Specification costs show up when the product has to change. That can mean different materials, formulations, labels, or packaging to meet local rules. And there’s a second hit here: product changes weaken economies of scale. Every new variant cuts average batch size and makes production scheduling messier.
Conformity assessment costs are the costs of proving you comply. Think lab testing, certifications, inspections, and audits. If there’s no mutual recognition agreement in place, companies often have to pay these costs all over again in each jurisdiction, with little chance to reuse earlier work.
The pain isn’t spread evenly. Electronics tends to be documentation-heavy. Automotive leans redesign-heavy. Pharma and medical products are often approval-heavy.
In automotive, specification and conformity assessment costs hit hard. A 2015 Center for Automotive Research study estimated that divergent U.S. and EU vehicle safety rules cost the industry $3.3 billion to $4.2 billion per year, with about $648 to $873 per vehicle in added compliance cost. [1][2]
Electronics looks different. It’s less about major capital changes and more about recurring paperwork and process demands. A 2009 industry study found that global RoHS compliance cost the electronics sector more than $32 billion upfront and about $3 billion annually to maintain. [3] That’s not just a launch cost. It keeps showing up year after year.
Whether the burden comes from redesigns, a new approval path, or another documentation cycle, the result is the same: higher fixed overhead, weaker standardization, and slower margin expansion. It also reduces batch sizes and makes plant scheduling tougher, which ties straight into SKU complexity and utilization pressure on unit economics.
Compliance labor and systems costs land directly in overhead. Most of these costs are fixed. Specialist staff, documentation systems, audit prep, and management time don’t shrink much just because sales volume is low.
That math is especially rough for smaller manufacturers. An SBA Office of Advocacy study found that firms with fewer than 20 employees faced compliance costs of $7,647 per employee, compared with $5,282 for firms with 500 or more employees. [5] A separate NAM-cited study put the federal regulatory burden on small manufacturers at about $50,100 per employee per year - or roughly $1 million annually for a 20-person firm. [4][6]
Every new jurisdiction adds another approval path, another set of documents, and another audit cycle, but not always enough extra volume to pay for it. Scale helps, but only when volume gets high enough to absorb those fixed compliance costs.
Scale protects margin only when compliance rules stay steady across markets. If the rulebook stays mostly the same, fixed compliance costs get spread over more units, and cost per unit drops. But once each market needs its own tweaks, that math starts to fall apart.
The math here is pretty straightforward. At 50,000 units, $40,000 in compliance costs works out to $0.80 per unit. At 100,000 units, that drops to $0.40 per unit - but only if the requirements stay the same. [14] Research on U.S. firms shows a similar pattern: costs tend to climb early on, then come down as firms get bigger. [7][11]
More throughput usually means lower overhead per unit. If a U.S. plant moves from 50% to 85% utilization, overhead per unit can fall by 30% to 40%. The reason is simple: the same fixed costs - facilities, equipment depreciation, salaried staff, and core quality systems—often managed by fractional CFO services - get spread across more units. [10][13][12]
That said, regulation can put a ceiling on utilization before a plant gets to that sweet spot. Validated processes often need requalification when products or processes change. Segregated batch campaigns, which are common in pharma and food manufacturing, interrupt long continuous runs. And market-specific SKUs add even more friction through:
Each one chips away at effective capacity and pushes overhead per unit back up, even when the plant looks fine on paper.
You see the same pattern with SKU complexity. More variants usually mean weaker batch efficiency and higher overhead per unit.
This is where scale can start working against itself. Local compliance rules often create SKU sprawl. Every market-specific variant adds setup time, QA release cycles, documentation work, and inventory needs. At the same time, demand gets split across more variants, which makes forecasting tougher and pushes safety stock higher.
Bain-cited analysis found that SKU complexity can increase supply-chain costs by up to 25%. [8] In one bakery and snacks case, more than 100 long-tail SKUs - each making up less than 1% of sales on its own - ate up nearly 25% of total supply-chain costs. Cutting that tail saved $22 million per year in logistics, warehousing, and production. [9]
If localized SKUs aren’t adding much extra revenue, they can quietly eat away at the margin gains scale was supposed to create.
Those mechanics create the expansion tradeoffs: global SKUs, regional compliance, or local plants.
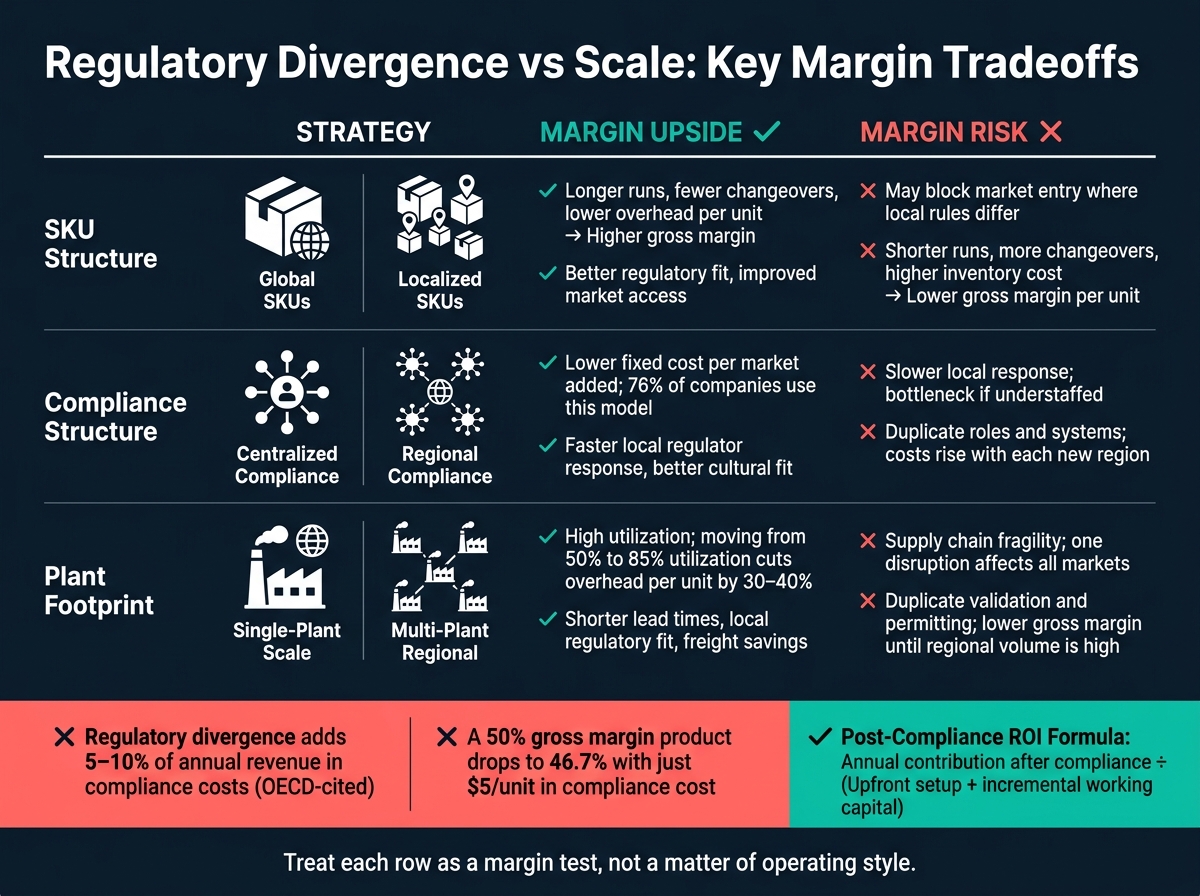
Regulatory Divergence vs Scale: Key Margin Tradeoffs for Multi-Market Expansion
Every multi-market expansion pushes founders into three structural calls: how many SKU variants to carry, where compliance should sit, and how many plants to operate. Each one hits gross margin, operating leverage, and execution risk in a different way. In plain English, each lever decides whether market divergence stays a fixed cost or turns into a recurring hit to margin.
Treat each row below as a margin test, not a matter of operating style.
| Strategy | Pros | Cons | Margin Effect |
|---|---|---|---|
| Global SKUs | Longer runs, fewer changeovers, simpler compliance, lower inventory | May limit market access; can't always meet local labeling or reimbursement rules | Higher gross margin per unit; stronger scale leverage |
| Localized SKUs | Better regulatory fit; improved market access and pricing | Shorter runs, more changeovers, higher inventory carrying cost | Lower gross margin per unit; margin recovery depends on volume uplift |
| Centralized Compliance | Consistent SOPs, lower incremental cost per new jurisdiction | Slower local response; bottleneck risk if understaffed | Higher operating margin at scale; compliance cost declines as revenue grows |
| Regional Compliance | Faster local regulator response; better cultural fit | Duplicated roles and systems; inconsistent policies across regions | Lower operating margin; costs rise with each new region added |
| Single-Plant Scale | High utilization, unified validation, lower overhead per unit | Long supply chains, larger inventory buffers, tariff exposure | Strong gross margin when utilization is high; vulnerable to disruption |
| Multi-Plant Regional | Shorter lead times, local regulatory fit, freight savings | Duplicate validation, separate permitting, coordination overhead | Lower gross margin due to fixed-cost duplication; improves with regional volume |
The next sections show where each choice helps and where it starts to hurt margin.
Start with SKU structure. It touches both compliance cost and plant efficiency.
A global SKU strategy protects margin only when local rules across target markets are close enough to support one product configuration, one label, and one documentation package. When that works, the upside is straightforward: longer production runs, fewer changeovers, and a smaller SKU count that makes forecasting easier and keeps safety stock lean.
Localized SKUs make sense only when the extra market access more than covers the added SKU, inventory, and compliance cost. That’s the tradeoff. If local changes help you enter a market or support better pricing, the math can work. If not, you’re just adding friction.
About 76% of surveyed companies use a centralized compliance structure. [15] That setup keeps fixed costs lower as new markets come online. Instead of rebuilding the same function again and again, companies can spread one team’s cost across more revenue.
Regional compliance flips that math. Duplicate roles, systems, and processes turn what could have been a fixed-cost edge into a semi-variable cost that rises with each new market. For early expansion below about $10 million to $20 million in annual run rate, the overhead of a dedicated regional compliance team is rarely justified. [16][17] Regional compliance starts to pay only when the business has enough scale to support duplicate staff and systems without squeezing operating margin.
A single-site strategy can look great on paper because it drives utilization, keeps validation under one roof, and lowers overhead per unit. The weak spot is supply chain fragility. One regulatory finding or one operating disruption can affect every market at the same time.
Multi-plant networks ease freight costs and reduce local regulatory friction, but they also bring duplicate validation, permitting, and quality systems. [18][19][20] That duplication carries a margin cost. In many cases, multi-plant expansion happens because local regulatory fit pushes the company there, not because logistics alone make it the better option. The economics improve only when regional volume is high enough to absorb those duplicate costs - or when local rules more or less require local production.
The structural choices covered above - SKU design, compliance setup, and plant footprint - only matter if you’ve done the math on what each path does to margin. Compliance costs don’t shrink nicely with revenue. That fixed-cost load hits smaller companies harder, which turns disciplined modeling into a competitive edge, not just a finance task. Use those tradeoffs to see whether expansion still clears your margin hurdle.
Put compliance costs in the right margin bucket. Amortize one-time certification costs. Charge recurring testing and labeling against gross margin. Assign SKU-level changeover costs to contribution margin.
Here’s a simple example. A hardware product priced at $150 with a $75 production cost may look like a 50% gross margin business in the U.S. But add $5 per unit in EU compliance testing and localization, and gross margin falls to 46.7%. That 3.3-point gap adds up fast at scale.
Track SKU complexity in contribution margin, not overhead. Once that margin hit is visible, compare markets by return on capital, not just revenue size.
A smaller market can still come out ahead if it needs less capital and gets approved sooner. One simple framework is to score each expansion option on four inputs:
The formula is simple:
Post-compliance ROI = Annual contribution after compliance and complexity costs ÷ (Upfront setup + incremental working capital)
To make it concrete, Market A might project $1.2 million in annual contribution but require $250,000 in certification and legal work plus $400,000 in extra inventory. That gives you an ROI of about 1.85x. Market B might offer only $750,000 in contribution, but need just $120,000 in setup and $200,000 in working capital. That works out to 2.34x. [21]
So even with lower topline potential, Market B gives you more return for each dollar put to work. Approval timelines matter too. A 9-to-12-month regulatory cycle delays cash inflows and burns runway, which changes the effective return even when annual contribution looks strong.
Founders who do this well treat each expansion as a margin test first and a revenue play second. They model compliance drag into unit economics before committing capital, rank markets by post-compliance ROI instead of market size, and pressure-test approval timelines against cash runway. Expansion works only when post-compliance margin stays intact.
Expansion helps margins only up to a point.
It stops paying off when the extra costs of complexity start beating the revenue from new markets. That usually shows up in a few painful ways: regulatory compliance gets heavier, operations split across too many systems or teams, and bookkeeping starts repeating the same work in different places.
Then the hidden costs pile up.
Tariffs above 25%, local market requirements, and manual processes that lead to mistakes can chip away at profit fast. What looked like growth on paper can turn into a drain on the business instead.
Run a cost-benefit analysis with your customer break-even point. Take the fixed costs of launching the localized SKU - compliance, localized marketing, and overhead - and divide that total by the expected contribution margin per customer. That gives you a simple way to see if the market is big enough to justify the spend.
Localization also takes a lot of tech, training, and research resources. Because of that, focus first on the highest-growth markets. It also helps to use scenario planning before you commit. Model total cost of ownership against possible tariff shifts or regulatory changes so you can see how the numbers hold up if conditions change.
Evaluate both financial viability and operational scalability. Start with the customer break-even point: fixed launch costs divided by contribution margin per customer.
Key metrics include net benefit, benefit-cost ratio, net present value, payback period, market penetration, customer lifetime value, and region-specific compliance costs. Set these thresholds in advance to avoid shifting goals and support long-term growth.