Published on
September 3, 2026


If I want a SaaS forecast I can trust, I don’t start with a growth target. I start with the math that drives revenue.
In plain terms, this method rolls revenue forward each month with one line of logic: Beginning ARR + new business + expansion - contraction - churn = ending ARR. That keeps the forecast tied to what the team can actually do: generate demos, convert deals, keep customers, and grow current accounts.
Here’s the full picture in one glance:
A few numbers show why this matters. Monthly churn can vary from about 1.5% to 3.0% for SMB and 0.2% to 0.5% for enterprise. Stage-based pipeline methods can improve forecast accuracy by 15% to 25% versus rep judgment alone. And top private SaaS firms often post 120%+ NRR, while many others land around 100% to 110%.
The main idea is simple: a good SaaS forecast should show where growth comes from, month by month, using inputs I can track and update.
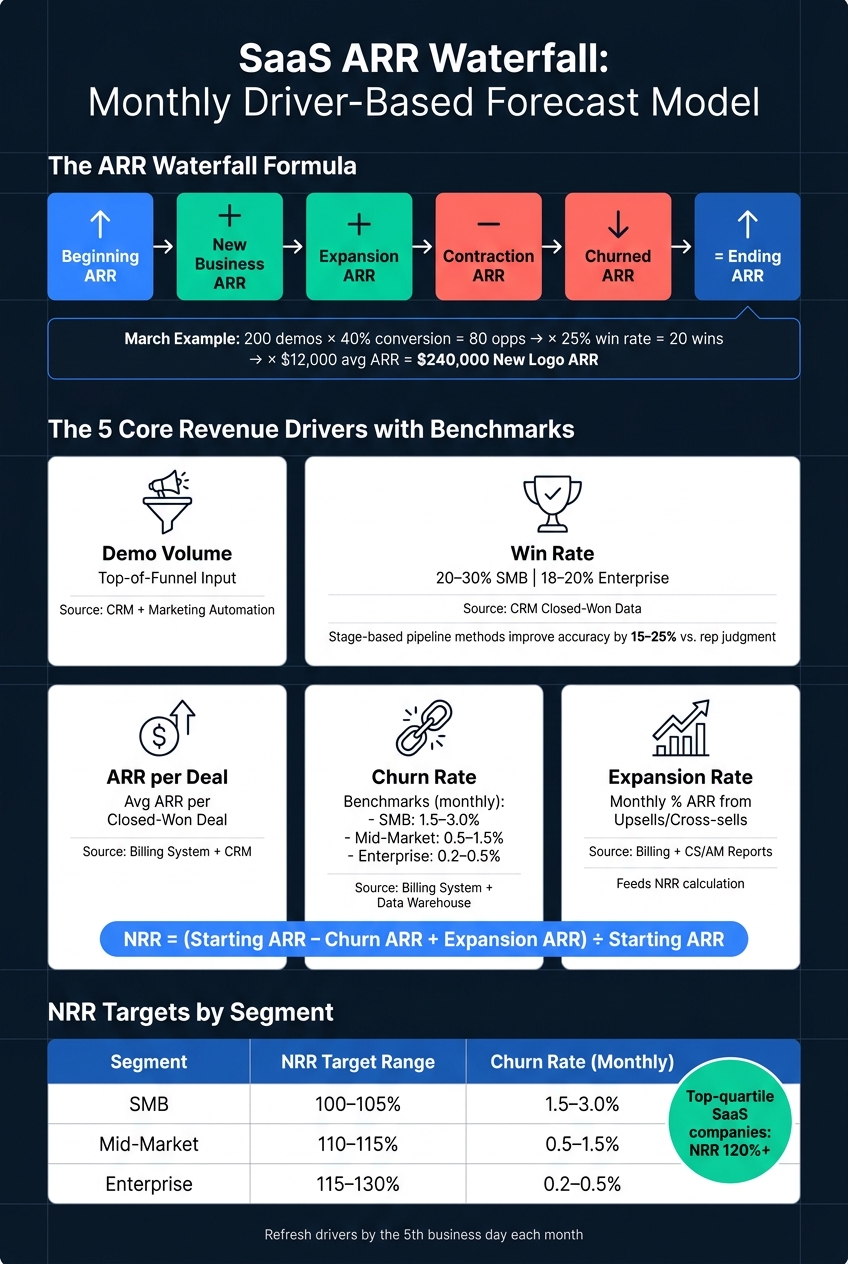
SaaS ARR Waterfall: Monthly Driver-Based Forecast Model
Once the waterfall is set, the next step is to turn those drivers into a monthly model that rolls forward without breaking every time you update one input.
Use five tabs: Assumptions, Pipeline & Bookings, Renewals & Churn, Expansion, and ARR/MRR Roll-Forward. The point is simple: when you update assumptions, those changes should flow through the waterfall on their own. No manual overrides. No hard-coded revenue lines. For many startups, this level of rigor is often established by fractional CFO services that specialize in driver-based modeling. Start with the pipeline-to-ARR spine, then add renewals and expansion on top.
This is the core of the model. It connects pipeline data to the ARR roll-forward and follows a simple path: demos → opportunities → wins → ARR.
Start with monthly demo counts that line up with CRM activity. Then apply your stage conversion rates and win rate to estimate wins. After that, multiply wins by average ARR per deal to get new logo ARR bookings.
Begin with one clean formula:
New Logo ARR = Demos × Opportunity Conversion Rate × Win Rate × Avg ARR per Deal
Here’s how that looks in practice:
March example: 200 demos × 40% demo-to-opportunity conversion = 80 opportunities; 80 × 25% win rate = 20 wins; 20 × $12,000 average ARR per deal = $240,000 new logo ARR. [1]
So if March has 200 demos, a 40% demo-to-opportunity rate, a 25% win rate, and $12,000 average ARR per deal, the model gives you 20 wins and $240,000 in new logo ARR.[1] That bookings line then feeds the roll-forward.
Set up one column per month. Each month’s output should flow into ending ARR, and that ending ARR should carry into the next month.
A lot of SaaS models go sideways here. They mash everything into one “net ARR” line and lose the story behind the numbers.
Keep each motion separate:
When you model these lines on their own, scenario changes are much easier to read. If ARR moves, you can see exactly what caused it instead of digging through one blended line.
Timing matters more than it first appears. A deal can close at the end of the month but not start until the next one, which means ARR should hit in the month the contract begins.
That’s why the pipeline module should include a contract start lag assumption. In many cases, that lag is 15 to 30 days.[2]
Contract start lag is a common timing assumption in U.S. SaaS forecasting practice.
You also want the model to match your billing cadence. With monthly billing, cash and ARR tend to stay closer together. With upfront billing, cash collection and revenue recognition can drift apart. Use the same monthly calendar as your CRM and billing system so actuals tie out cleanly.
Once the model structure is set, the next job is adding logic that matches how the business actually runs. The simplest way to do that is to model each driver as its own monthly line in the waterfall. Each one should tie a day-to-day operating input - like demos, win rate, churn, or expansion - to a monthly ARR change.
Build new ARR from the full path, not from a top-line guess.
Use this chain: completed demos → qualified opportunities → closed-won deals × average ARR per deal → new ARR. Industry benchmarks put demo-to-close conversion at 22–30% for B2B SaaS overall, with SMB products around 20–30% and enterprise deals around 18–20%.[5][6][9][10] Start with your own past conversion rate, then compare it against those ranges as a sanity check.
There’s one more layer here. Not every rep can close an unlimited number of deals, and new reps don’t perform at full output on day one. So your model should cap bookings based on rep capacity and ramp. It should also move closed deals out by the median sales-cycle length. That way, the timing of ARR lands in the right month instead of showing up too early.
Churn should be modeled on the current customer base by segment, then rolled forward month by month. A single blended churn rate usually looks clean in a spreadsheet, but it can hide what’s actually going on. An SMB base can be jumpy, while enterprise accounts may stick around much longer. If you blend them together, the model can miss risk on both ends.
Logo churn and revenue churn are not the same thing, so they belong on separate lines. Logo churn shows how many customers left. Revenue churn shows how much recurring revenue left with them. That difference matters. A group of small accounts can churn and barely dent ARR, while one enterprise downgrade can hit revenue hard without changing logo count much at all.
The formulas are simple:
Model these rates by segment instead of blending them. Monthly benchmarks run about 1.5–3.0% for SMB, 0.5–1.5% for mid-market, and 0.2–0.5% for enterprise.[7][8]
Cohort-based modeling is usually a better fit than applying one churn rate to the whole base. In plain English, that means grouping customers by start date and tracking how each group survives and grows over time. Why does that matter? Because churn is often highest in the first 3–6 months after activation, then levels off as accounts become more embedded.
Expansion ARR - upsells, cross-sells, and seat growth - should sit on its own line. It should be modeled as a rate applied to surviving ARR, not treated like new logo revenue. If you count it as new business, the model will understate NRR and skew CAC payback. Growth from current customers will look like brand-new acquisition, and that muddies the picture.
A clean way to do it is to start with surviving ARR, then apply the monthly expansion rate. Those rates often differ by segment. Enterprise accounts tend to expand more because upsells can play out over multi-year cycles. SMB accounts usually grow at a lower rate.
This line feeds straight into net revenue retention, or NRR:
NRR = (starting ARR – churn ARR + expansion ARR) ÷ starting ARR
Use segment NRR ranges as guardrails:
| Segment | NRR Target Range |
|---|---|
| SMB | 100–105% |
| Mid-market | 110–115% |
| Enterprise | 115–130% |
These driver lines set up the monthly bookings and retention views in the next section.
With the monthly waterfall set up, the next move is to bring CRM activity and renewals into the same model. The goal is simple: turn the monthly driver model into CRM pipeline, renewal, and KPI outputs that all point to the same set of numbers.
Start by making sure every opportunity in the CRM uses the same four fields: stage, deal type (new logo, expansion, or renewal), ACV band, and customer segment. Each one should also include an expected close date and an ARR/MRR amount so it lands in the forecast in the right place.
Next, assign close probabilities by stage using at least 12 months of historical closed-won data. Typical B2B SaaS ranges look like this: about 10%–20% at Discovery, 20%–30% at Qualification, 35%–50% at Proposal/Demo, 60%–75% at Negotiation, and 80%–95% at Verbal Commit.[4][21]
From there, multiply each opportunity’s ARR by its stage probability. Then place that probability-weighted ARR into the month tied to the expected close date. Export open opportunities by stage, segment, and ACV band each month and link that data into the forecast model.
There’s a practical wrinkle here. Rep-entered close dates are useful, but they’re often a little optimistic. Blending that date with the average time-to-close by stage usually gives you a better monthly bookings view.
That weighted pipeline view becomes the new-business input to the monthly MRR waterfall.
Once the waterfall is live, your core SaaS metrics should come out of formulas, not hand-built spreadsheets. That keeps the math clean and cuts down on reporting drift.
The monthly MRR waterfall identity is:
Ending MRR = Beginning MRR + New MRR + Expansion MRR − Contraction MRR − Churned MRR[15][16][18]
Net new MRR comes straight from the same logic: New MRR + Expansion MRR + Reactivation MRR − Contraction MRR − Churned MRR.[18] NRR uses those same building blocks as a percentage: (Starting MRR + Expansion MRR − Contraction MRR − Churned MRR) ÷ Starting MRR.[18][20] Gross retention strips out expansion and uses this formula: (Starting ARR of the cohort − Churn/Contraction ARR) ÷ Starting ARR of the cohort.[18][17] Year-over-year ARR growth is ending ARR divided by ending ARR 12 months earlier, minus one.
When these metrics link straight to the waterfall, the operating model, board deck, and fundraising materials stay in sync. You’re not telling one story in the board meeting and another in the planning file. Since each metric comes from the same source, the board view and the operating model stay aligned.
As a benchmark, top-quartile private SaaS companies often run NRR above 120%, while median companies tend to land around 100%–110%.[11][12][13]
Once the outputs are formula-driven, the same model can handle planning scenarios without changing the structure. Keep the model itself fixed, then build separate assumption sets for Base, Upside, and Downside cases. Flex the drivers that matter most: demo volume, win rate, average deal size or ACV, churn rate, and expansion rate.[16][14][19]
For example:
Each scenario creates a different ARR path, net new MRR path, and NRR output. That gives leadership a direct read on how much growth is backed by the current pipeline and how much could slip if a few drivers move the wrong way.
After month-end close, load actuals, update the assumptions, and rerun the scenarios. The next step is spotting the mistakes that distort these outputs.
Once the model is live, a few mistakes tend to throw it off.
These five errors break most SaaS forecasts. Driver-based models hold up better because they connect revenue to pipeline, retention, and expansion inputs.
Teams that apply historical win rates by stage to pipeline see 15–25% better forecast accuracy than teams that rely on rep input alone.[22]
Here’s where models usually go wrong, and how to fix them:
| Logic Error | Symptoms | Fix |
|---|---|---|
| Single blended churn rate | NRR looks stable, but SMB or enterprise segments are hiding decline inside specific groups | Split churn by segment and tenure. Give each cohort its own rate in the waterfall |
| Expansion counted as new ARR | "New ARR" looks strong, but actual new logo pipeline is thin | Separate new logo, expansion, and contraction into different waterfall lines |
| No contract start date or ramp modeling | Big deals hit ARR at once, but billing shows later start dates or phased rollouts | Add start-date and ramp-profile drivers. Link close date to start date in the waterfall |
| Hard-coded numbers | Driver changes don’t move the forecast, and month-to-month jumps don’t make sense | Replace hard-coded figures with formulas. Separate inputs from outputs in the model |
| No pipeline-to-bookings reconciliation | Forecast keeps beating actuals, while win rate and cycle time assumptions drift | Run a monthly reconciliation that compares expected bookings to closed-won results. Then update the drivers |
A lot of this comes down to one simple issue: mixing different revenue motions into one line. When that happens, the model may look clean on the surface, but it stops telling you what’s going on underneath.
Use these six inputs to keep the forecast tied to current CRM and billing data and to stop the errors above from creeping in. Refresh them by the 5th business day of each month.[23][3]
| Driver | Definition | Typical Data Source | Where It Feeds in the Forecast |
|---|---|---|---|
| Demo volume | Qualified product demos or discovery calls per month, by segment | CRM + marketing automation (e.g., Salesforce, HubSpot, Marketo) | Top-of-funnel input to new logo bookings; drives opportunity creation and new ARR |
| Conversion rate (lead → opportunity) | % of marketing-qualified leads that become sales opportunities | CRM and RevOps reports | Turns raw lead volume into grounded opportunity counts before win rate is applied |
| Win rate | % of opportunities closed-won, by segment and product | CRM closed-won vs. closed-lost data | Applied to pipeline to forecast monthly new bookings and new ARR |
| ARR per deal | Average ARR per closed-won deal, by segment | Billing system and CRM (invoiced amount per new logo) | Turns expected wins into the dollar value of new ARR in the waterfall |
| Churn rate | Monthly % of ARR lost from cancellations or major downgrades, by cohort | Billing system and data warehouse | Reduces existing ARR in the monthly roll-forward; feeds gross retention and NRR |
| Expansion rate | Monthly % of ARR gained from upsells or cross-sells to existing customers | Billing system and CS/AM reports | Adds expansion ARR on top of retained ARR; drives NRR and same-store growth metrics |
This is the part teams often skip. They build the model, trust it for a quarter, and then stop feeding it current inputs. At that point, the forecast starts drifting, even if the spreadsheet still looks polished.
The monthly waterfall is the forecast.
Keep new business, retention, and expansion separate. New logo ARR is a sales and pipeline issue. Churn is a product and segment issue. Expansion is a customer success issue. Blend them together, and you lose sight of which motion is doing the work.
Tie pipeline timing to actual close months, and the forecast becomes useful for decisions like hiring, marketing spend, and runway. Refresh the drivers each month, compare actuals, and update the model.
Use at least 12 months of historical actuals. 24 months is even better.
That amount of data gives you a clearer read on seasonality, growth trends, and recurring variances that a simple average can gloss over.
It also gives you room to back-test the model against actual results. Before you use it for budgeting or hiring, aim for ±5% to 10% accuracy on total revenue and ±10% to 15% accuracy for each major segment.
Track both.
Use MRR as your main operating baseline because it shows the month-to-month shifts that move the business: new business, expansion, contraction, and churn.
Then convert ending MRR to ARR with MRR × 12.
MRR works best for monthly management and trend tracking. ARR is useful for run-rate planning, fundraising, and board reporting.
Update your SaaS driver-based revenue forecast every month. Once the month closes, swap forecasted numbers with actual results, run a variance check, and adjust your assumptions when performance starts drifting by about 5% to 15%.
You don’t need a full rebuild every week. A lighter weekly check-in for key metrics is usually enough. Then, once a quarter, do a deeper reset for longer-term assumptions.
It also makes sense to update the model outside the normal cycle when something big changes, like:
That way, your forecast stays tied to what’s happening in the business instead of turning into a stale spreadsheet.