Published on
September 4, 2026


Most companies make one forecast. As a fractional CFO, I’d rather run three. That gives me one plan to operate the business, one plan for upside, and one plan for protection if revenue slips.
Here’s the short version:
A simple way to think about it:
| Scenario | What I use it for | Common trigger | Typical response |
|---|---|---|---|
| Best case | Add growth spend with control | Bookings or pipeline stay above plan for months | Add hires in steps, then expand spend |
| Base case | Run the business day to day | Default plan unless data moves off track | Keep approved budget and staged hiring |
| Downside | Protect cash and extend runway | Revenue miss, churn jump, or runway under 12 months | Freeze hires, cut non-core spend, protect margin |
A three-scenario plan works best when I review it every month, reset assumptions each quarter, and switch plans based on data instead of hope.
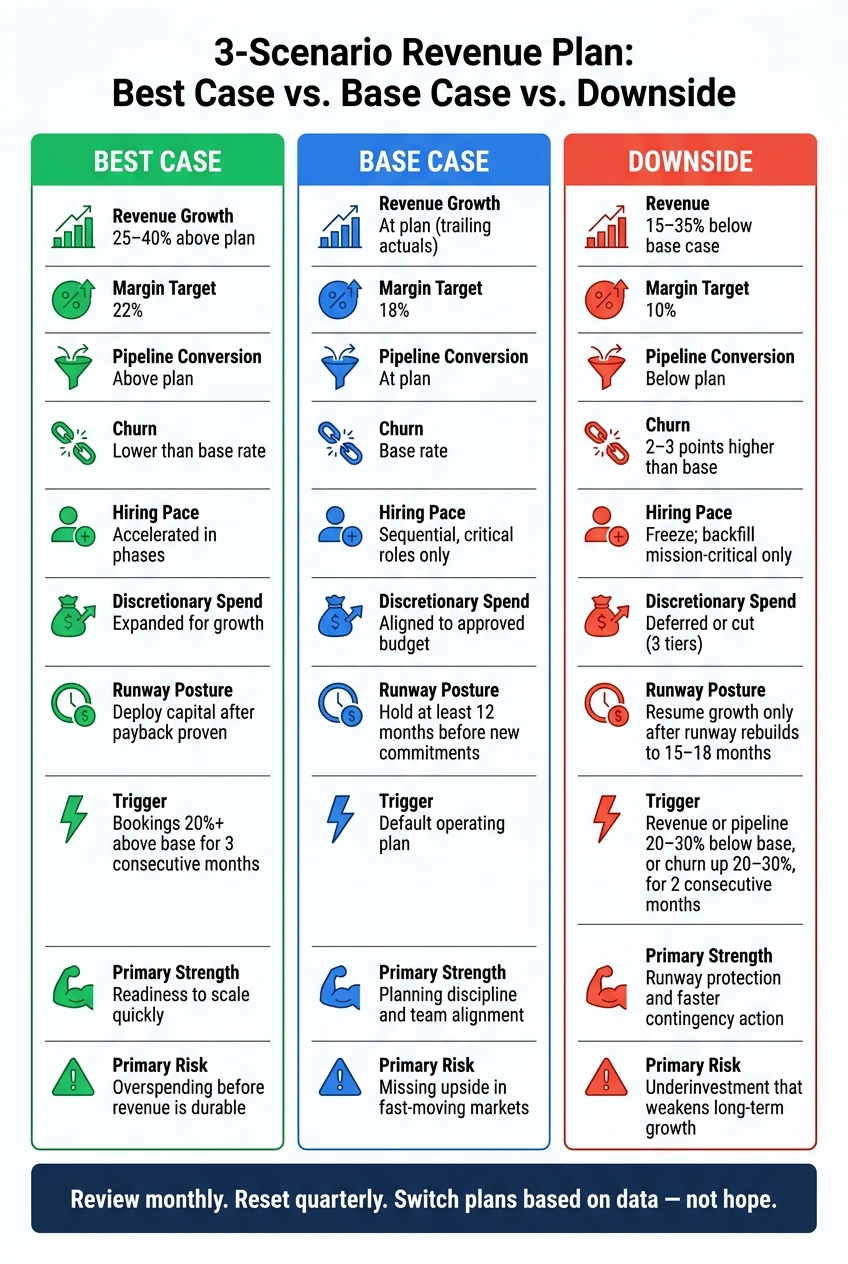
3-Scenario Revenue Plan: Best Case vs Base Case vs Downside
For a U.S. growth-stage SaaS company, the best case usually means 25%–40% revenue growth over the plan period. It also assumes annual price increases of 5%–10%, gross dollar retention above 95%, net revenue retention of 120%–140%, and win rates reaching about 28%. Those numbers shouldn't sit in a spreadsheet by themselves. Each one needs to connect to a clear operating move.
Set up a three-column table for each driver: downside, base, and best. That makes the plan easy to scan and even easier to pressure-test.
If monthly new customer adds average 50, you might set:
Average selling price could range from $9,000 in the downside case to $11,000 in the base case to $13,000 in the best case, based on packaging changes and negotiated discounts. Conversion from qualified opportunity to closed-won could move from 18% to 22% to 28%.
Here’s the key part: every assumption should tie back to a source. That could be past performance, pipeline coverage ratios, or market benchmarks. Leadership needs to see what has to go right for the best case to happen. And each assumption should point to a decision on hiring, pricing, or spend.
The best-case plan only works when the business starts showing the right signals. Common triggers include a qualified pipeline staying at 4–5x quota for three or more consecutive months, new account executives reaching full quota in 3–4 months instead of the usual 6, and product milestones landing on time so the company can support higher price points or move into new customer segments.
Teams usually watch these signals through weekly or monthly dashboards, sales forecasts, and product roadmaps. If two or more of these triggers hold for two straight quarters, leadership has a solid reason to shift capital allocation toward the best-case plan instead of getting ahead of the numbers. If the triggers don't hold, the base case remains the operating plan. [7][5]
When those triggers hold, hiring and spend should increase in phases, not all at once. Start with sales and marketing after the early signals show up. Then add product and support after two quarters of outperformance against base-case metrics and after hitting the stated margin thresholds. Infrastructure comes after that.
Even in an optimistic plan, timing matters. You still need to account for normal time-to-fill and onboarding windows. Marketing dollars should move toward the channels with the best ROI, such as events or referrals. It also helps to track labor cost as a share of revenue so margin pressure shows up early, not after the budget is already stretched. [6]
A company with 24 months of runway in its base case could see that extend to 30–36 months in the best case if revenue growth comes in 10–15 percentage points higher and gross margins stay in place. Operating margin could move from -20% in the base case toward -5% or break-even. Burn as a share of revenue also drops, which leads to a better burn multiple for investors.
If those thresholds don't hold, keep the base case as the operating plan. [8][4]
The base case is the operating plan. It’s the forecast leadership uses for budgets, hiring, and day-to-day planning. This version should reflect normal execution, not lucky breaks. While the best case leans on upside triggers, the base case stays grounded in what the business is doing now.
Start with trailing three-month averages for new customer acquisition and churn. Then make changes only when the history backs them up. The table below ties each driver to current performance.[12]
| Driver | Base-Case Treatment |
|---|---|
| New customer acquisition | Use trailing actuals as the starting point |
| Conversion / win rate | Stay near historical performance unless improvement is already proven |
| Average selling price / contract value | Use current pricing, or only approved changes |
| Churn / retention | Stay close to current cohort behavior |
| Expansion revenue | Treat expansion as upside, not core forecast |
| Sales cycle length | Keep within the modeled historical range |
Every assumption needs a source. That source can be internal history, cohort data, or benchmarks.[13]
Once those inputs are locked in, the next step is simple: decide which signals show whether the plan is on track.
Leadership should watch leading indicators like MRR growth, pipeline coverage, bookings, renewals, sales productivity, and gross margin. These are the early warning lights. If pipeline coverage falls below the target multiple for two straight months, or if sales cycles move past the modeled range, the business is drifting away from the base case.[11][1]
When that happens, leadership needs to react. That can mean:
Fund the teams that keep the engine moving: sales, customer success, core marketing, and product enablement. Push lower-priority spending to later. Add headcount in tranches tied to revenue milestones.
That approach matters. A staged plan gives the company room to move if revenue lands near the low end of the expected range. Big fixed costs can box you in. Variable spending gives you more breathing room.
The model should show runway and the minimum cash buffer needed to absorb normal variance. Many venture-backed companies aim for at least 18 months of runway in the base case.[10]
On margins, define the gross margin path and, when it applies, the EBITDA or operating margin path under normal execution. Be clear about where the gains come from: pricing, mix, scale, or lower acquisition costs. Not best-case bookings.
That runway and margin picture shapes how much hiring and fixed spend the business can carry. If those targets start to slip, the downside case should take over before cash pressure starts building.
Those same drivers also frame the downside case, where the priority shifts from growth to runway protection.
The downside plan is your realistic, data-backed case for a period when several core drivers miss at the same time. Its role is simple: show runway, show how far milestones may slip, and show what the company will do next. To make that plan useful in the moment, you need clear assumptions, hard triggers, and pre-set actions.
Start with your base-case drivers, then pressure-test only the ones most exposed to demand swings, pricing pressure, or churn. For a typical U.S. growth-stage company, downside assumptions often look like this:[9][20][21]
| Driver | Downside Adjustment |
|---|---|
| Revenue | 15–35% below base case |
| Customer acquisition cost (CAC) | 30–40% higher than base |
| Churn | 2–3 points higher |
| Sales cycle | 30–50% longer on enterprise or high-ticket deals |
| Average selling price | 5–15% lower due to discounts, downgrades, or mix shift |
These numbers shouldn't come out of thin air. Tie each one to something you can point to: your own past misses, industry data, peer results, or prior downturn periods such as 2020.[9][19]
A downside plan only works if leadership knows exactly when to switch to it. That means setting firm, numeric thresholds ahead of time instead of relying on gut calls when stress is high.
Common triggers include:
Track these triggers every week through FP&A dashboards, CRM reports, and revenue reviews.[11][1]
Once a trigger is hit, the response shouldn't be improvised. It should already be mapped out in tiers so the team can act fast and stay calm.
Each tier should include a dollar impact on monthly cash burn, in USD. That way, leadership can see what each move buys in runway.
The downside plan should roll straight into a runway view. Many growth-stage companies aim for 18–24 months of runway even in downside conditions, with 12 months treated as a hard alarm line that calls for immediate action.[14][15][16][17]
You also want to model gross margin and operating margin. Discounts, downgrades, and mix shifts can squeeze margins, while tighter cost control can offset part of that pressure. The point is to show how lower revenue can still protect runway and keep funding options open.[18][9][2]
Those tradeoffs lead into the side-by-side view of how all three scenarios shape hiring, spend, and runway.
Each scenario changes spending, hiring, and runway, not just revenue.
Use the grid below to turn each revenue path into clear calls on hiring, spend, runway, and margin. It lays out the operating tradeoffs side by side.
| Decision Area | Best Case | Base Case | Downside |
|---|---|---|---|
| Margin Target (illustrative) | 22% | 18% | 10% |
| Pipeline conversion | Above plan | At plan | Below plan |
| Churn | Lower than base | Base rate | Higher than base |
| Hiring Pace | Accelerated if upside persists | Sequential, critical roles only | Freeze; backfill mission-critical only |
| Discretionary Spend | Expanded for growth initiatives | Aligned to approved budget | Deferred or cut |
| Runway posture | Deploy more capital only after payback is proven | Hold at least 12 months of runway before new commitments | Resume growth spending only after runway rebuilds to 15–18 months |
| Trigger | Bookings 20%+ above base for 3 months | Default operating plan | Revenue or pipeline 20%–30% below base, or churn up 20%–30%, for 2 consecutive months |
The main question isn't which forecast looks highest on paper. It's which operating plan matches each outcome.
Best case assumes faster deal closure, stronger pricing realization, and lower churn. Base case assumes execution lands at plan. Downside assumes slower collections, more discounting, and longer sales cycles.[28][26]
That means hiring should follow scenario triggers, not hope. In the best case, you can add hiring cohorts if the upside keeps showing up. In the base case, sequence hires and stick to critical roles. In the downside case, freeze hiring and discretionary spend.
Runway and margin decide whether a plan can be funded. In the base case, keep at least 12 months of runway before taking on new commitments. In the downside case, growth spend should wait until runway is back to 15 to 18 months.[27][28][3]
Gross margin compression is often the first warning sign. Discounts and mix shifts can pull margin down by 6 to 10 points before revenue misses show up in the top line.[25]
These tradeoffs set up the pros and cons of each scenario.
Once your triggers are set, this side-by-side view makes the next step easier: deciding how each scenario should change day-to-day operating choices. The table below shows what each one is built for and where things can go off track.
| Scenario | Primary Strength | Primary Risk |
|---|---|---|
| Best Case | Readiness to scale quickly if demand beats plan | Overspending before revenue is durable |
| Base Case | Planning discipline and cross-team alignment | Missing upside in fast-moving markets |
| Downside | Runway protection and faster contingency action | Underinvestment that weakens long-term growth |
The best-case scenario works best as a readiness tool. It gives leadership a way to preapprove moves like hiring more account executives or adding customer success capacity, so the company can act fast if revenue comes in above plan. The danger is simple: treating the upside case like the main plan. If spend ramps before revenue is durable, fixed costs climb and cash gets tight.
The base case is usually the most useful option for day-to-day operations. It gives sales, finance, marketing, and operations one shared plan built on the same assumptions. That kind of alignment matters. Without it, teams can pull in different directions. The weak spot is rigidity. In a fast market, a company can miss upside if it waits too long to act. A practical fix is to set an upside trigger that opens hiring once revenue beats plan by a set percentage.
The downside scenario is about protecting runway and making contingency action faster and less subjective. When cuts are defined ahead of time, the response is faster and less emotional. That said, not every soft patch calls for a hard stop. Freezing revenue-producing roles should be saved for sustained weakness, not a short-term dip.[28][29][18]
These tradeoffs should feed straight into the conclusion’s operating rule for hiring, spend, and runway.
A three-scenario revenue plan only works when each case is tied to clear triggers, spending rules, hiring thresholds, and runway and margin targets.
The rule is straightforward: the base case runs the business, the best case greenlights upside spend, and the downside case sets cuts and timing. But that only holds up when leadership reviews actuals on a fixed schedule.
Cadence is what turns planning into something useful instead of a static forecast sitting on a slide. Monthly reviews should compare actual results against the base case. Quarterly reviews should reset assumptions and runway for each scenario.
When repeat variance shows that the trend has changed, the plan should change too. If revenue stays above or below plan for two straight quarters, reset the base case. Then update hiring, spend, and triggers to line up with actual performance.
Phoenix Strategy Group helps growth-stage companies build integrated FP&A systems that connect scenario plans to budgets, hiring, and board reporting.
Base trigger thresholds on historical performance and direct business impact, not rough guesses. Start with the metrics that hit hardest when they move: churn, sales cycle length, and close rates are common examples. Then look at how those numbers have shifted over the past 12 to 24 months so you know what “normal” looks like.
Set thresholds around clear risks or clear misses. For example, you might act when runway falls below 12 months or when revenue misses plan for two straight months. Each threshold should also have a preset response attached to it, like freezing discretionary spend or pausing noncritical hiring.
That way, you’re not making tough calls in the heat of the moment. The rule is already there, and so is the next step.
Shift to the downside scenario when performance comes in about 5% to 15% below your base case. Do the same when volatility picks up, problems start piling up, or trigger events hit, like falling revenue or higher costs.
Use it early, not late. If your model shows runway slipping below a key line like 12 months, that's your cue to act. The same goes if you may need backup moves such as:
This scenario gives you a way to respond before the pressure gets worse.
Update your three-scenario revenue plan at least once a month so your projections stay in line with how the business is actually performing. A simple way to do this is to use your month-end close to compare actual results with the forecast.
You should also revise the plan after major events, like product launches, pricing changes, or major market shifts. Then, on a quarterly basis, take a deeper look at your long-term assumptions.