Published on
September 5, 2026


Most e-commerce exits are priced on profit, not just sales. If I’m running a fast-growth brand with thin earnings, buyers may look harder at revenue. But if I’m selling a steadier business with clean profit, EBITDA usually drives the offer.
Here’s the short version:
If I want a better price, I need to show that my revenue is repeatable, my margins hold up, and my financials are clean. Buyers usually check revenue, EBITDA, and SDE together, then price the business based on risk and cash flow.
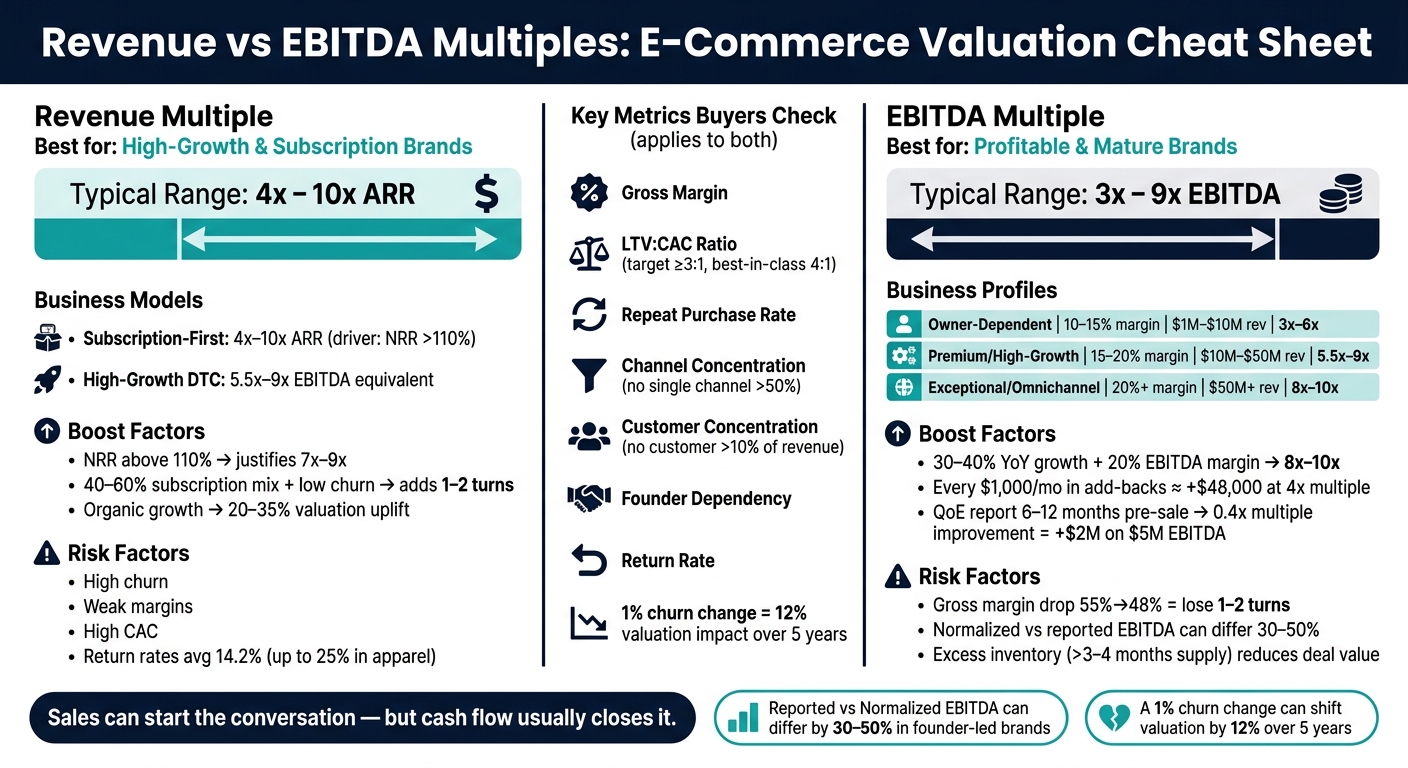
Revenue vs EBITDA Multiples: E-Commerce Valuation Cheat Sheet
| Valuation Lens | Best Fit | Common Range | What Buyers Focus On | What Can Hurt Value |
|---|---|---|---|---|
| Revenue | Subscription-heavy or fast-growth brands | 4x to 10x ARR | Retention, NRR, growth quality | Churn, weak margins, high CAC |
| EBITDA | Profitable, more mature e-commerce brands | 3x to 9x EBITDA | Normalized earnings, margin stability, transferability | Margin pressure, channel concentration, founder reliance |
Put simply: sales can start the conversation, but cash flow usually closes it.
A revenue multiple values a business based on top-line revenue. Buyers tend to lean on this method when recurring sales make future cash flow easier to forecast. Put simply, the more steady and repeatable the revenue, the more likely a buyer is to focus on revenue instead of current profit.
Revenue multiples usually make more sense when current EBITDA doesn't fully show the business’s future earning power [1]. That often happens when a brand is spending hard on customer acquisition or building up inventory. On paper, profit may look thin. But the business can still earn a premium if that growth has staying power.
Subscription-first e-commerce brands are the clearest case. These businesses are often valued at 4x to 10x ARR, and brands with NRR above 110% can justify 7x to 9x on their own [1]. A subscription mix of 40% to 60% with low churn can also add 1 to 2 turns of EBITDA multiple versus less predictable, acquisition-led models [1]. That said, in private-market exits, buyers still usually anchor on earnings.
| Business Model | Typical Multiple Range | Key Value Driver | Main Valuation Risk |
|---|---|---|---|
| Subscription-First | 4x – 10x ARR [1] | Net Revenue Retention (>110%) [1] | High churn rates |
| High-Growth DTC | 5.5x – 9x EBITDA [1] | Organic growth rate | Rising CAC / paid media reliance |
Revenue multiples can paint too rosy a picture when top-line growth isn't backed by margin quality. Revenue may overstate value when margins are weak, return rates are high, or paid traffic quality is poor [2]. E-commerce return rates average 14.2% across the industry and can reach 25% in fashion and apparel, which can materially change the value of reported sales [2]. Buyers also discount growth driven only by higher ad spend. Growth powered by organic demand can earn a 20% to 35% valuation uplift [1].
Gross margin trends matter too. A drop from 55% to 48% gross margin can cost 1 to 2 turns of EBITDA multiple [1]. That’s why buyers don’t stop at headline revenue. They dig into the quality of that growth. Once growth starts to slow and profit becomes a clearer signal, buyers shift back to EBITDA.
When growth starts to level off and profit comes into focus, buyers usually shift to EBITDA. Revenue is no longer the main signal. Instead, they value the business based on normalized EBITDA, not accounting EBITDA. The formula is simple: Enterprise Value = EBITDA × Multiple. What changes from deal to deal is the multiple, and that comes down to one thing: how steady and transferable the cash flow looks.
EBITDA becomes the main pricing lens when a business starts to look mature. Buyers want to see stable contribution margins, repeatable operations, and a company that doesn’t lean too hard on the founder. That usually means documented SOPs, a solid team, and enough structure that the business can keep running after ownership changes hands.
At that stage, current profit often says more than future revenue projections.
| Business Profile | Typical EBITDA Margin | Revenue Scale | Typical EBITDA Multiple |
|---|---|---|---|
| Owner-Dependent | 10% – 15% | $1M – $10M | 3x – 6x |
| Premium / High-Growth | 15% – 20% | $10M – $50M | 5.5x – 9x |
| Exceptional / Omnichannel | 20%+ | $50M+ | 8x – 10x |
Source: Synthesized from Eightx 2026 M&A advisor data [1].
Exceptional businesses - those pairing roughly 20% EBITDA margins with 30% to 40% year-over-year growth - can push toward 8x to 10x [1].
For brands under $2 million in EBITDA, buyers often use SDE instead. Above that level, EBITDA is the standard yardstick [2].
Raw EBITDA almost never matches the EBITDA buyers use to price the deal. In founder-run e-commerce businesses, reported EBITDA and normalized EBITDA can differ by 30% to 50% [2]. That spread usually comes from add-backs, one-off costs, and expenses that won’t carry over under new ownership.
The most common accepted adjustments include:
There’s a catch, though. Buyers often use a two-year rule. If an expense appears in two of the last three years, they’ll usually treat it as recurring and keep it in the cost base. That matters a lot in practice. Every $1,000 per month in documented add-backs can add about $48,000 to the closing price at a 4x EBITDA multiple, so clean records can have a direct effect on the deal value [2].
Buyers also look hard at any signs of inflated EBITDA. A common example is when a founder cuts paid media spend during the three to six months before going to market just to boost short-term profit. Sophisticated acquirers reset marketing spend to a 12- to 18-month average to correct for that [2]. Excess inventory matters too. If the business is holding more than three to four months of supply, buyers tend to treat that as cash tied up in stock and reduce deal value to account for it [1].
From there, the multiple tends to move based on growth rate, margin profile, and the quality of the business model.
Once EBITDA is normalized, buyers don’t stop there. They pressure-test that number against revenue growth, margin staying power, and the type of business model behind the sales. No single valuation method fits every deal. Revenue multiples and EBITDA multiples each show something different, so buyers pick the lens that matches the business in front of them.
| Metric | Best For | Typical Range | Key Drivers | Main Risks |
|---|---|---|---|---|
| Revenue (ARR) | Subscription-heavy brands with predictable recurring revenue | 4x – 10x ARR [1] | Churn rate, NRR | High churn, high CAC |
| EBITDA | Profitable DTC brands with more than $2M EBITDA | 3x – 9x EBITDA [1] | Margin stability, organic growth velocity | Margin erosion, channel concentration |
Growth only helps if buyers think it will turn into lasting cash flow. That’s the key idea.
Fast growth can support a revenue-based lens when retention, margins, and repeat purchase patterns show that the sales base will stick. Subscription-heavy brands with 40% to 60%+ of revenue tied to recurring models can earn revenue-based multiples when they also post high NRR and strong gross margins [1]. In a few cases, brands that pair 30% to 40% YoY growth with about 20% EBITDA margins can move into the 8x to 10x EBITDA range [1].
A high revenue multiple also needs a few things working together:
Without those signals, a big top line is much harder to defend on its own.
Margins affect valuation more than many founders expect. Even a modest slide can hurt. For example, a drop in gross margin from 55% to 48% can cost 1 to 2 EBITDA turns [1].
That matters even more in DTC, where return rates put pressure on profit. DTC return rates average 14.2% across the category and can hit 25% in apparel [2]. Buyers look closely at that because headline margin and lasting margin are not always the same thing.
Thin or jumpy margins weaken both revenue-based pricing and EBITDA-based pricing. If contribution margins move around too much, the business will struggle to support a strong EBITDA multiple. It will also have a tougher time earning a revenue multiple if sales don’t turn into steady cash flow.
Experienced buyers rarely lean on one number alone. Most deals get checked from a few angles: revenue, EBITDA, and SDE. That matters even more in smaller, founder-led businesses, where owner pay is often buried deep in the financials.
In plain English, the multiple is just shorthand for risk-adjusted cash flow. Buyers then test that number against revenue quality and margin staying power.
That’s why founders need to know how these methods work together, not in isolation. Buyers compare more than one metric, and the assumptions behind each one matter just as much as the final multiple.
The real prep work before an exit sits in the operating metrics underneath those multiples.
Before an exit, buyers don’t just look at revenue and EBITDA on the surface. They test the multiple against the operating metrics underneath it. If you want to protect valuation, you need to show that growth, margins, and cash conversion can hold up over time.
| Metric | Effect on Revenue Multiples | Effect on EBITDA Multiples |
|---|---|---|
| Trailing 12-Month Revenue Growth | Primary driver for growth-based pricing | Secondary; growth should not come at the expense of margin durability |
| Gross and EBITDA Margin | Lower impact, but declining margins can signal lower-quality growth | High impact; consistency and benchmark performance matter |
| LTV:CAC Ratio | High impact; it supports future revenue scalability and market fit | Moderate impact; it reflects cash conversion efficiency and profit durability |
| Repeat Purchase Rate | Positive; it supports higher LTV and brand loyalty | Positive; it improves predictability of future cash flows |
| Channel Concentration | High risk; concentration compresses revenue multiples | High risk; it increases the risk discount applied to earnings |
| Inventory Turnover | Usually negative; poor turnover may signal obsolete stock | Negative; it ties up cash and raises carrying costs |
| Founder Dependency | Negative; it can limit scalability | Negative; it can cause meaningful multiple compression |
Out of all of these, concentration and unit economics tend to trigger the biggest multiple cuts.
No customer should account for more than 10% of revenue, and no single channel should go above 50%. Once more than half of revenue depends on one platform, like Amazon, Meta ads, or one wholesale account, buyers usually bake that risk into the deal through lower multiples or earnouts [2]. And this doesn’t just hit one side of the valuation. It pushes down both revenue multiples and EBITDA multiples.
Unit economics carry just as much weight. Aim for an LTV:CAC ratio of at least 3:1, with 4:1 viewed as best-in-class, to prove growth efficiency [3]. Even a small shift in retention can change the picture in a big way. A 1% difference in churn can have a 12% impact on company valuation over five years [3]. That’s why repeat purchase rate and net revenue retention should be tracked well before a sale process begins.
After those core metrics are in shape, buyers usually zero in on normalized earnings. A sell-side QoE report, done 6 to 12 months before going to market, can help lock in normalized earnings. For a business with $5 million in EBITDA, a 0.4x improvement in the multiple can add $2 million in exit value [2].
Phoenix Strategy Group helps growth-stage e-commerce founders clean up books, build KPI dashboards, and prepare M&A-ready reporting.
Revenue multiples make more sense for high-growth brands that are deliberately keeping profits low to fund expansion. EBITDA multiples fit mature, cash-generating businesses where earnings quality and margin consistency carry more weight. In most e-commerce exits, buyers look at both. The method that matters most is usually the one that best matches how the business actually runs.
Founders who put time into growth quality, margin durability, unit economics, and reporting accuracy are in a much better spot to support a stronger revenue or EBITDA valuation when the stakes are highest.
It depends on your business model and where the company is in its growth cycle.
For most established, professionally run e-commerce businesses - especially those bringing in more than $5 million to $10 million in revenue - EBITDA is the go-to metric. Why? Because it gives a clearer view of operating profit and the cash flow the business can keep producing over time.
Revenue multiples show up more often with high-growth direct-to-consumer brands or subscription businesses that have strong recurring revenue and low churn. On the other hand, if the company is smaller and still owner-operated, Seller's Discretionary Earnings is usually the better fit.
Normalized EBITDA starts with standard EBITDA and then strips out non-recurring or one-time costs to show the company’s core operating performance.
In plain English, it helps you see how the business is actually doing day to day, without odd accounting items or unusual events muddying the picture. That makes the numbers easier to compare from one period to the next.
Focus on the metrics that show your business is predictable, transferable, and scalable. Buyers tend to care more about durable earnings than top-line revenue.
Track:
This set of numbers helps show that the business can keep performing without too much drama, and without everything resting on one person, one customer, or one sales channel.