Published on
September 25, 2026


If a wind project is exposed to market prices, one forecast is not enough. I’d use a base case for screening, a downside case for debt stress, and a stochastic model when merchant risk can change leverage, hedge design, or value.
Here’s the short version:
If I only need a first-pass view, I’d stick with a single case. If I’m testing loan safety, I’d move to a downside case with P90 production, lower prices, and lower realized price levels. If I need to know the probability of a DSCR breach, reserve draw, or tail-loss outcome, I’d use stochastic analysis.
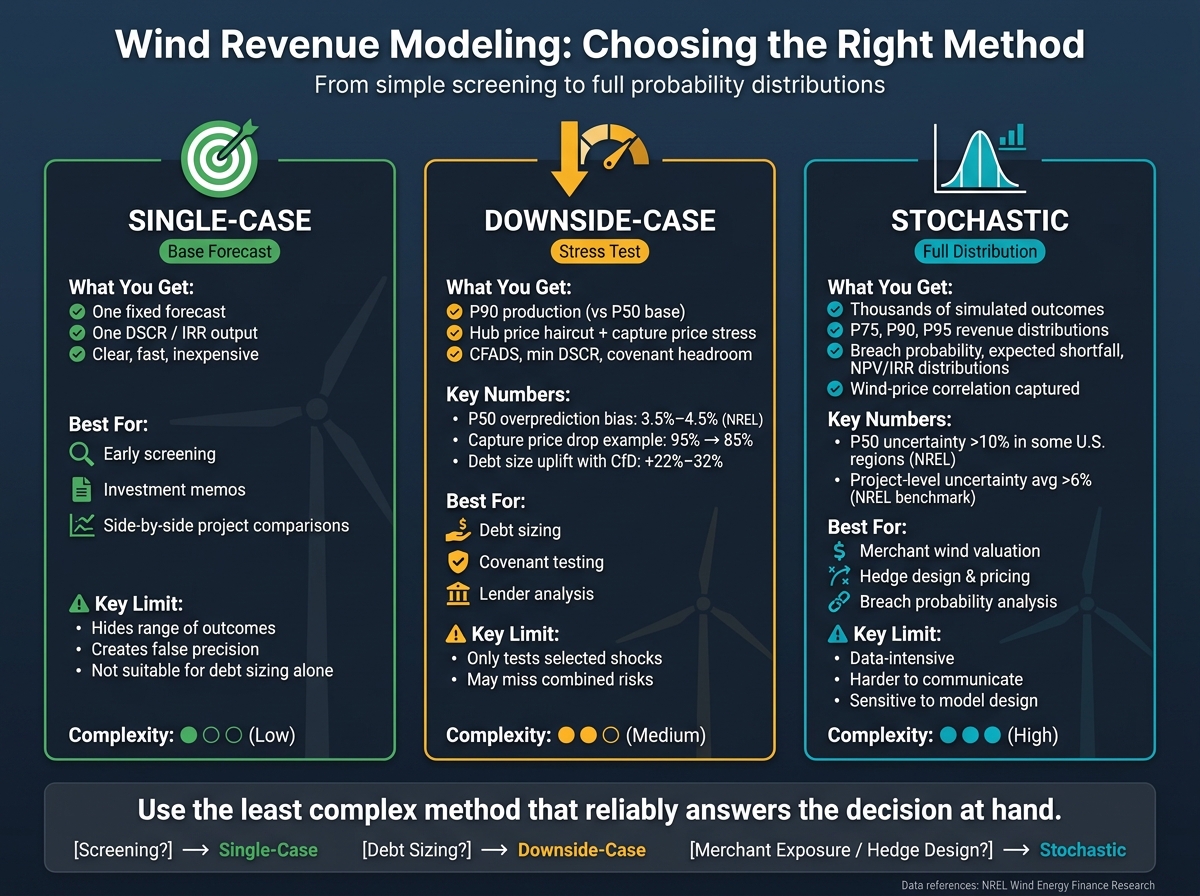
Wind Revenue Modeling Methods: Single-Case vs Downside vs Stochastic
| Method | What I get | Best use | Main limit |
|---|---|---|---|
| Single case | One forecast | Early screening, internal plan | Hides range of outcomes |
| Downside case | Adverse stress view | Debt sizing, covenant review | Only tests selected shocks |
| Stochastic case | Distribution of outcomes | Merchant valuation, hedge review, breach probability | More data and model work |
My takeaway: use the least complex method that still answers the decision in front of you - but don’t ignore capture-price risk, correlation between wind and price, or early-year cash pressure.
Single-case modeling uses one set of assumptions to produce one forecast. It’s the most straightforward of the three approaches, and it gives you a base case that downside and stochastic models can test later. The upside is clarity. The trade-off is that you don’t see much risk.
A single-case model needs documented inputs for capacity, net generation, availability, curtailment, degradation, price assumptions, O&M, land, insurance, taxes, and debt terms.
For merchant projects, the price input carries a lot of weight. That could be a forward curve or a long-term consultant forecast. Either way, the source needs to be stated clearly and tied to a specific reference. If that piece is fuzzy, the whole output can drift.
The biggest weakness here is false precision. A single DSCR or IRR can look exact on the page while hiding scenario risk underneath.
For merchant wind, that problem gets sharper because output and price often move the wrong way at the same time. Low wind years tend to line up with weak power prices, which can stack the revenue hit in a way a single average won’t show [1][5].
A few simple sensitivities usually tell the story fast:
Those tests show where the model is most exposed. That’s why the next step is a downside case.
Single-case modeling works well for early screening, investment memos, and side-by-side project comparisons when everything is measured on the same basis.
But it has limits. Its usefulness depends on disciplined, transparent assumptions. It should not be used by itself for debt sizing, setting reserves, or pricing hedges on merchant-heavy projects [2][3].
Every input should be documented with its source, date, unit, and owner. Keep assumptions on a separate input sheet. Label price forecasts by source - forward curve, consultant forecast, or internal estimate - because those are not interchangeable and can lead to materially different valuations [4][7].
The single case gives you the point forecast. The downside case shows how fast cash flow can crack under pressure.
That’s the point of downside-case modeling: test whether the project can still service debt when key assumptions come in below plan. To do that, the model uses conservative inputs for the variables that matter most - production, price, curtailment, availability, transmission congestion, and costs - and checks whether the project can still meet its financial obligations.
On the production side, the model should use a P90 estimate instead of the P50 base case. P50 is median production. P90 is output exceeded in about 90% of modeled years [6][10].
That gap matters more than it may seem at first glance. NREL research found an average P50 overprediction bias of about 3.5%–4.5% in a subset of U.S. wind farms after accounting for curtailment [5]. In plain English, the base case may already lean a bit optimistic before you add any downside stress.
On the price side, don’t just cut the annual average price and call it done. Stress both the hub forecast and the capture price, which is the realized price after location, hourly generation profile, basis, congestion, curtailment, and hedges all do their work. Wind often generates during high-wind, lower-price hours, so a 10% hub-price haircut plus a capture-price drop from 95% to 85% is more grounded than trimming the average price alone.
A downside case should make the weak spots easy to see. Show CFADS, minimum DSCR, covenant headroom, liquidity needs, the worst year, reserve draw, and any distribution lockup.
For a proper stress test, put the base, downside, and severe combined stress cases next to each other. That severe case should combine the hits that tend to hurt at the same time: low wind, low prices, high curtailment, and a temporary outage.
This is also where downside analysis becomes useful in financing discussions, not just modeling. One academic study found that a two-sided contract for difference increased modeled offshore-wind debt size by 22%–32% compared with a purely merchant structure [9]. That’s a clean example of how a downside case can show the financing value of contract protection in dollar terms.
Lenders usually size debt using P90 production, while sponsors look at equity returns using P50 [8][4]. So the model should say, clearly, what each case is for: lender sizing or sponsor return analysis.
If the downside case fails a covenant test, the model shouldn’t stop at “IRR is lower.” It should show the fix. That may mean:
That still leaves one issue on the table: how wide the outcome range gets when inputs move probabilistically.
Every stressed input should be documented with its source, date, unit, owner, and exact adjustment. Use version control, and keep input sheets separate from calculation sheets.
Stochastic modeling simulates thousands of combined wind, price, and cost outcomes to show the full merchant wind revenue distribution. Instead of relying on one fixed “conservative” case, the model moves wind production, power prices, basis, curtailment, availability, and operating costs at the same time. The result is a distribution, not a single forecast.
Annual averages alone won't do the job. The model needs monthly or hourly data to reflect price capture, congestion, and negative-price periods.
The part that many single-case and downside models miss is correlation. When wind output is high across a region, power prices often fall too. If you treat production and price as separate variables, you can materially overstate merchant wind revenue. A stochastic model deals with that by linking wind and price through synchronized historical data or a joint simulation that ties wind conditions to both output and price.
For a U.S. project, start by defining:
That setup matters because it shapes a revenue distribution, not just one forecast.
The output goes far beyond P50 and P90. A well-built stochastic model reports P75, P90, and P95 annual revenue, the probability of breaching a debt-service coverage ratio covenant, expected shortfall, the average outcome in the worst tail, and NPV and IRR distributions. NREL notes P50 uncertainty can exceed 10% in some regions, with project-level uncertainty averaging more than 6% in its benchmark analysis [1]. That spread is exactly what a stochastic model makes visible.
Results should be shown by year, not only as a lifetime average. A project may look fine across a 20-year average and still run into several early years when cash flow falls short of debt service. That's where liquidity pressure and covenant stress show up, and a lifetime average would never catch it.
Stochastic outputs are most useful when they feed straight into financing choices. The model can compare an unhedged merchant position with a fixed-price hedge, a collar, or partial coverage. From there, it can measure expected NPV, downside NPV, cash-flow volatility, and the probability of a covenant breach under each structure.
That gives decision-makers something concrete to work with, such as:
Stochastic models bring more complexity, so governance matters even more. Historical price series, wind data, turbine availability assumptions, loss factors, contract terms, and tax assumptions each need a documented source, time period, and version history. Raw files should be stored separately from calculation sheets.
Each run should stay reproducible with fixed random seeds and version history, so an investment committee or lender can trace the logic from assumption to output.
That rigor improves insight, but it also adds modeling burden and data demands.
The trade-off is pretty straightforward: faster models are simpler to use, but probability-based models do a better job of reflecting merchant wind risk.
| Approach | Main Advantages | Main Drawbacks | Best For |
|---|---|---|---|
| Single-case | Fast, inexpensive, easy to explain | Hides uncertainty; creates false confidence | Early screening, initial negotiations |
| Downside-case | Tests resilience; supports conservative debt sizing and P90-style lender analysis | Only examines selected shocks; may miss combined risks | Conservative debt sizing, covenant testing |
| Stochastic | Quantifies probabilities, correlations, and tail risk | Data-intensive; harder to communicate; sensitive to model design | Merchant wind exposure, valuation, complex hedges |
That table lays out the core trade-off. The practical question is: who should use each method, and when?
Equity investors usually run all three. They use a base case to test the main investment thesis, a downside case to check survivability, and stochastic analysis to see the return range across P10 to P90.
Lenders and risk reviewers usually start with downside cases for debt sizing. Then they turn to stochastic outputs to measure breach probability across scenarios. That matters because a single downside case doesn't show much when wind and prices move together.[11][2]
Buyers and sellers use stochastic modeling to split resource risk from price risk. That helps them decide whether to price the risk, reserve against it, or contract around it. In merchant wind deals, stochastic modeling makes it easier to see how much value comes from resource risk versus price risk.
A simple rule works well here: use stochastic modeling only when the probability output changes the decision. If it affects leverage, bid price, hedge tenor, or reserve sizing, the added modeling cost makes sense. If the project is mostly contracted and the decision probably won't move much across reasonable scenarios, a solid base case plus a clearly defined downside case is often the better use of time and money.
After comparing the three methods, the right choice depends on the decision in front of you. Use a single case for screening, downside cases for debt-service stress tests, and stochastic modeling when merchant exposure - especially when capture-price risk and wind output move together - can change financing, valuation, or hedging decisions.
A good way to handle this is to start simple. Build a transparent single case first. Then add structured downside tests to check resilience. Move to stochastic simulation only when the distribution of outcomes matters for the call you need to make.
As the model gets more complex, the validation burden goes up too. A single-case model needs clear, documented assumptions and a formula check. A downside-case model needs stress assumptions that make economic sense and do not double-count adverse events. A stochastic model needs credible historical and forward data, tested distributions, tested correlations between wind output and nodal prices, and independent review of resource, price, and curtailment inputs. That last point matters more than it may seem. Preconstruction resource forecasts can run optimistic, so an outside review can keep the model grounded.
The table below shows which groups get the most use from each approach and what level of validation each one calls for.
| Approach | Primary decision makers | Core validation requirement |
|---|---|---|
| Single-case | Developers, commercial teams, management | Transparent assumptions, formula check, reconciliation to operating or consultant forecasts |
| Downside-case | Lenders, risk teams | Economically plausible stresses, no double-counting, P90/P99 production conventions defined |
| Stochastic | Investors, sponsors, valuation and hedging teams | Tested distributions, tested correlations, independent resource and price review, convergence testing |
The final principle is simple: use the least complex method that reliably answers the decision at hand. More complexity adds cost and can make communication harder. If stakeholders can’t interpret or trust a stochastic model, it won’t help a financing outcome. Whatever method you use, require traceable data, clear P50/P90 conventions, documented assumptions, and back-testing against actual wind production, capture prices, curtailment, and operating results.
A single-case model is often enough when you need to frame a deal early or give boards and investors a simple, clear view. It works well when you want to show base, upside, and downside cases side by side, with clean, traceable links from assumptions to value.
It’s best used as a starting point before moving to probabilistic methods, such as Monte Carlo simulations, to assess risk distributions.
Capture price matters because it shows the actual revenue earned for each unit of electricity sold - not just the average market price.
That difference can be a big deal. Wind projects often produce the most power when supply is high or demand is low. And when that happens, prices can fall.
So even if the market’s average power price looks fine on paper, a wind project may still earn less than expected in practice. That spread between output and realized revenue flows straight into NPV, IRR, and debt service coverage, which is why capture price plays such a big role in risk and valuation.
Stochastic modeling improves debt sizing and hedging by swapping fixed-case assumptions for probability distributions. Instead of relying on a base case and a couple of side scenarios, lenders can see which constraint is most likely to bite across many possible outcomes.
When CFADS is calculated in each simulation, the model shows the odds of missing DSCR covenants. That gives lenders and sponsors a sharper view of how debt should be sculpted, how much support the DSRA may need, and which hedges or contract terms should target the main sources of financial swing.