Published on
July 28, 2026


If I want a SaaS forecast I can trust, I need one Excel file that links MRR, bookings, churn, expansion, pipeline, rep ramp, and cash. That gives me a 24- to 36-month view of revenue, burn, and runway without mixing sales output with P&L revenue.
Here’s the short version:
MRR × 12A few numbers make the point fast. A $24,000 annual deal books $24,000 on the close date, but it adds only $2,000 MRR and is recognized over the contract term. And if I begin with $80,000 MRR, add $8,000 new MRR, lose $2,400 to churn, and add $1,552 in expansion, I end the month at $87,152 MRR, or $1,045,824 ARR.
What this article shows me: how to set up the workbook, what inputs to gather, how to build the MRR engine, how to use pipeline and rep ramp, and how to turn that into a cash view I can review every month.
Underlined takeaway: <u>a good SaaS forecast is not just a sales model or an accounting model - it ties both together in one monthly view.</u>

Before you write a single formula, put the workbook in order. A clean model keeps inputs, calculations, and outputs separate, which makes the logic much easier to check. If someone else opens the file, they should be able to follow it without digging through random tabs and hard-coded cells.
Set up six sheets and place them left to right from inputs to outputs:
| Tab name | Purpose |
|---|---|
| 01_Inputs_Assumptions | All inputs and assumptions |
| 02_MRR_Build | Monthly waterfall: new, expansion, contraction, churn, ending MRR |
| 03_ARR_Bookings | ARR, bookings, and revenue recognition outputs |
| 04_Cohorts_Retention | Cohort-level MRR with retention curves by tenure month |
| 05_Pipeline_Sales_Ramp | New MRR from pipeline and rep ramp schedules |
| 06_Cash_Runway | Revenue into P&L, burn rate, and ending cash balance |
On the Inputs_Assumptions sheet, give each driver its own row with four columns:
For example, you might enter Starting MRR = $125,000/month and Logo churn = 2.5%/month. This setup keeps each assumption in one place, so when you update a single cell, every downstream sheet updates with it. No digging around for buried numbers inside formulas.
Format each input table as an Excel Table with Ctrl+T. Then use named ranges or absolute references so assumptions always point back to one source cell.
Create one monthly timeline across the top of each calculation sheet, using one column per month. In cell B3 of MRR_Build, enter =DATE(2027,1,31) and format it as m/d/yyyy, so it shows 1/31/2027. In C3, enter =EOMONTH(B3,1) to return 2/28/2027, then drag that formula across 24 to 36 columns.
Name that range Month_End_Dates so the other sheets can use the same timeline instead of rebuilding it again and again.
Keep every calculation on a monthly basis. Once you start mixing weekly and quarterly timing into the same model, things get messy fast, especially when you're trying to tie MRR back to cash runway.
For formatting, keep it simple:
Also add a version box with the model version, last updated date, and owner.
This setup makes the workbook much easier to audit during funding and lender diligence. With the structure and timeline in place, the next step is building the monthly MRR waterfall.
SaaS Churn Modeling Methods: Which Fits Your ARR Stage?
With your workbook set up and your timeline ready, it’s time to build the formulas that drive the forecast. This part has three pieces: the MRR waterfall, the bookings schedule, and cohort-based retention.
Start with the monthly waterfall:
Ending MRR = Starting MRR + New MRR − Churned MRR + Expansion MRR
Use month-end values across the board. On your 02_MRR_Build sheet, create one row for each part of the formula and one column for each month.
Here’s a simple example: $80,000 starting MRR + $8,000 new MRR − $2,400 churn + $1,552 expansion = $87,152 ending MRR. ARR would be $1,045,824.
A small but important point: apply expansion only to retained MRR. And use ARR = Ending MRR × 12 as a run-rate view, not GAAP-recognized revenue.
Now split what gets sold from what gets recognized. They’re not the same thing.
A $24,000 annual contract books $24,000 when it closes. But its monthly run-rate MRR is $2,000, and revenue gets recognized over the contract term.
Set up a separate contract-level schedule tab where each row is one contract. Then spread the monthly recurring amount across the contract term with an IF formula tied to your monthly timeline. Sum each month’s column to get total recognized revenue for that period.
| View | Primary focus | Most useful for |
|---|---|---|
| Bookings schedule | Booking date, contract term, TCV, upfront cash | Sales performance, cash planning, board updates |
| MRR schedule | New, expansion, churned MRR, ending MRR, ARR | Valuation, unit economics, scenario planning |
Keeping these separate makes life a lot easier. Sales reporting stays clean, and revenue recognition does too.
A single churn rate can work early on. But it starts to fall apart once your data gets deeper.
New customers often churn more than customers who’ve been with you for 18 months. So if you use one flat monthly churn assumption, the forecast can drift as the customer base ages.
That’s where cohort modeling helps. On your 04_Cohorts_Retention sheet, group customers by acquisition month. Put acquisition months in rows and tenure months in columns. Use SUMIFS to pull retained MRR by cohort and tenure month, and COUNTIFS to track logo retention.
The goal is to build a retention curve that feeds the MRR waterfall. Instead of using one churn number for everyone, you get a retention curve for each cohort.
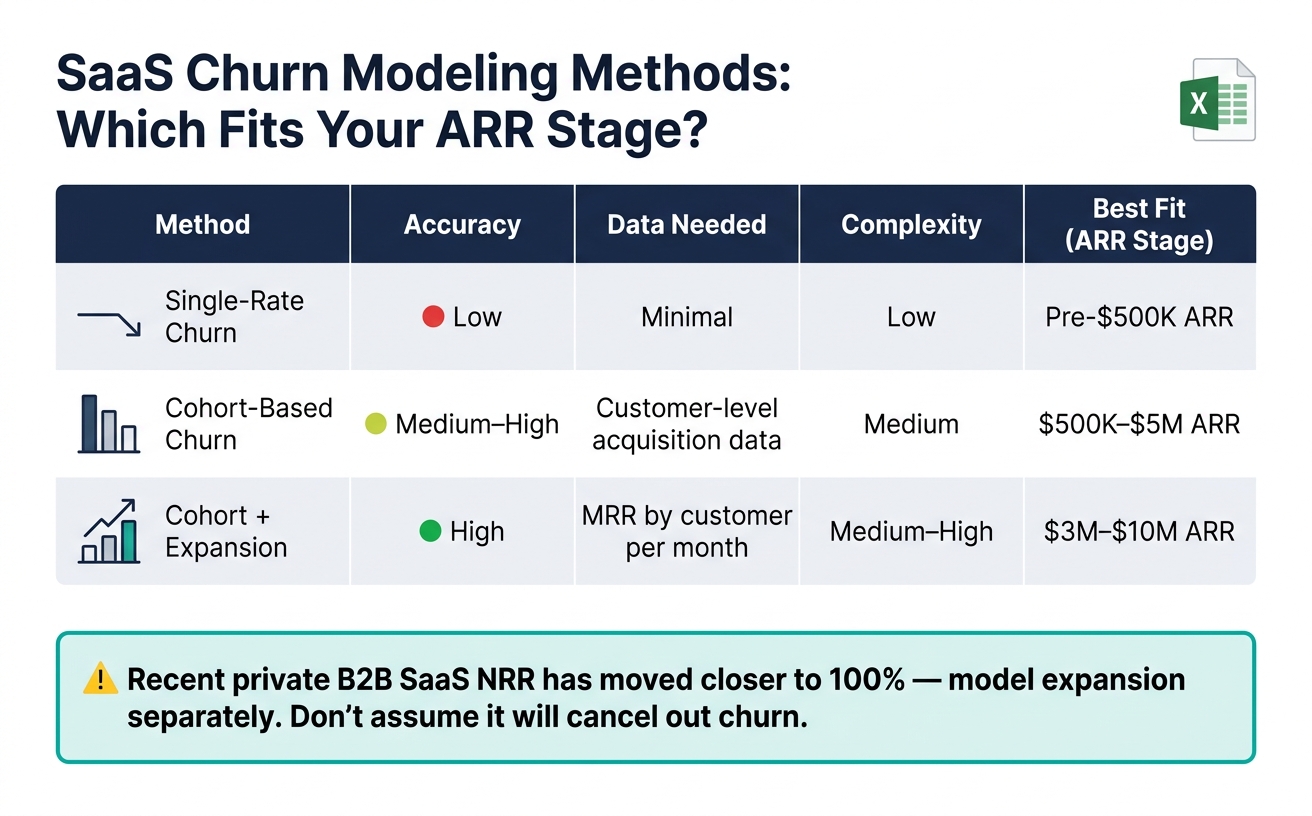
| Method | Accuracy | Data needed | Complexity | Best fit |
|---|---|---|---|---|
| Single-rate churn | Low | Minimal | Low | Pre-$500K ARR |
| Cohort-based churn | Medium–High | Customer-level acquisition data | Medium | $500K–$5M ARR |
| Cohort + expansion | High | MRR by customer per month | Medium–High | $3M–$10M ARR |
Recent private B2B SaaS NRR has moved closer to 100%, so expansion doesn’t always cover churn anymore. Model expansion on its own. Don’t bake in the assumption that it will cancel out churn.
Cohort-plus-expansion modeling makes that shift visible before it turns into a cash problem.
With retention in place, the next step is turning pipeline and rep capacity into new MRR.
The MRR waterfall tells you where revenue sits today. This part connects that view to pipeline, hiring plans, and runway so the forecast reflects what’s happening in the business.
Start by pulling open opportunities from your CRM into a separate Pipeline sheet and updating it every week. Use one row per deal. At a minimum, include expected MRR, sales stage, stage probability, and expected close date in MM/DD/YYYY format. Then add two formula-based columns: Weighted MRR and close month.
Weighted MRR is simple:
deal MRR × stage probability
From there, use SUMIFS to group weighted MRR by close month and send that number into the New MRR from pipeline row in your monthly forecast.
Weighted pipeline should be your main forecast input. Top-down and capacity-based models still matter, but they work best as sensitivity checks. After that, layer in rep ramp so the model reflects both when deals may close and how much selling capacity the team actually has.
New reps don’t hit full output on day one. A common ramp curve looks like this: Month 1 = 25% of quota, Month 2 = 50% of quota, Month 3 = 75% of quota, Month 4+ = 100%. For mid-market roles with longer sales cycles, ramp usually takes longer. Some teams model 25% for months 1–3, 60% for months 4–6, then 100% from month 7 onward.
Set up a Sales Capacity sheet with one row for each rep. Include:
Then calculate each rep’s effective quota by month as:
full quota × ramp percentage
Add those effective quotas across all reps to get total capacity-based bookings for each month. When you plug in a planned hire, the model shows exactly when that person starts to contribute and how much that changes your MRR path. That’s useful because hiring can look great on paper, but the timing is what makes or breaks the plan.
Feed those bookings into the cash model.
Once forecasted MRR is in place, build a P&L and Cash sheet around this chain: Revenue → Gross Margin → Operating Expenses → Burn → Runway.
Start with your gross margin assumption and apply it to forecasted revenue. Then model COGS, including hosting, third-party tools, and customer success costs. That gives you gross profit dollars each month.
Next, subtract operating expenses by category:
What’s left is monthly operating burn. Set a starting cash balance, then subtract monthly burn to calculate ending cash. Runway can be shown in one of two ways: Cash balance ÷ average monthly burn, or as the month when ending cash hits zero.
This is where revenue timing turns into cash timing.
Phoenix Strategy Group helps align revenue forecasts with accounting, KPI, and cash data.
Once you’ve built the base forecast, the next step is to see how it holds up when conditions change. Point each revenue and cash formula to one Active Scenario cell so you can switch scenarios without rewriting formulas. INDEX or CHOOSE works well here because the toggle stays in a single cell.
On your Assumptions sheet, set up three clearly labeled blocks: Base, Best, and Worst. Keep the same columns for each driver so the model stays easy to follow. That usually includes:
Use historical variance to set each scenario. That part matters. Base should reflect current performance. Best should assume achievable gains in growth, churn, and expansion. Worst should reflect a plausible slowdown or decline. In plain English: don’t make up random percentage swings. Tie scenario changes to what the business has actually done before.
Then compare the numbers that drive decisions: ending ARR, net new MRR, peak burn, and runway months. This is where the model stops being a spreadsheet exercise and starts helping with actual calls. If the Worst case pushes runway below your comfort threshold, you may need to slow hiring, cut discretionary spend, or start fundraising planning earlier. If the Best case still shows strong ARR growth and plenty of runway, you may have space to invest more in sales.
The point isn’t to admire three neat scenarios on a sheet. The point is to know what you’ll do if the downside case starts showing up.
After each month’s close, refresh actuals and review the forecast against plan. Look at MRR, ARR, net new MRR, bookings vs. recognized revenue, cohort retention, rep ramp, burn, and runway.
That turns the file from a reporting artifact into a decision tool for hiring, spending, and fundraising. Each month, it should help answer a simple question: does growth, retention, and cash still support the current plan?
Make the forecast detailed enough to tie business drivers to financial results. The cleanest way to do that is with a bottom-up MRR model built around the moves that actually change revenue:
This setup helps you show why revenue is expected to grow or stall. Instead of dropping in a top-line number and hoping it feels right, you build MRR from the ground up. New customers add revenue. Expansion increases spend from current accounts. Contraction pulls revenue down when customers downgrade. Churn removes revenue altogether. That gives you a model that’s much easier to explain to investors, finance teams, and department leads.
A solid forecast usually looks 12 to 24 months ahead. That’s long enough to spot patterns, pressure-test the plan, and see how today’s choices affect cash later on. It should also include cohort analysis, pipeline-based projections, and clear assumptions for CAC, LTV, and burn rate.
Cohort analysis matters because not all customers behave the same way over time. A customer who signed in January may retain, expand, or churn at a very different rate than one who signed in June through a different channel or pricing plan. Looking at revenue by cohort lets you track whether retention is getting better, whether payback is improving, and whether growth is coming from healthy customers or from constant replacement.
Pipeline-based projections keep the model tied to sales reality. If the sales team says $200,000 in new MRR is coming next quarter, the forecast should show where that number comes from: open pipeline, stage-by-stage conversion rates, average deal size, and sales cycle length. Otherwise, the plan is just guesswork dressed up in a spreadsheet.
Your assumptions should also be easy to audit. CAC shows what it costs to win a customer. LTV shows what that customer is worth over time. Burn rate shows how fast the company is using cash. Put those side by side, and you get a much clearer picture of whether growth is efficient or expensive. If new MRR is rising but CAC is climbing faster, that changes the story. If expansion revenue is strong and churn is low, profitability may arrive sooner than the top-line revenue alone would suggest.
It also helps to model three scenarios:
These scenarios are not there to make the deck look polished. They’re there to test cash runway and the path to profitability under different conditions. Maybe the optimistic case assumes stronger conversion rates and lower churn. The base case may reflect current trends. The pessimistic case might factor in slower sales, weaker expansion, or a bump in customer losses. That kind of range gives decision-makers something far more useful than a single neat forecast: a view of what could happen, what would drive it, and how much margin for error the business has.
Use cohort churn when you need to spot customer patterns that a flat churn rate can miss. A flat rate is simpler, sure. But it can blur important differences, like heavy churn right after onboarding versus stronger retention later on.
Cohort analysis groups customers by things like acquisition period, product tier, or contract type. That gives you a clearer view of how each segment performs over time and helps you build more precise revenue projections.
Use a monthly refresh cycle as your starting point. Compare actual results against your forecasts every month, then run a variance analysis to see where things drifted. If results are off by more than 5% to 15%, dig into the cause and update your assumptions fast.
It also helps to refresh the model around key operating cycles and major events. That can include biweekly payroll, product launches, or pricing changes. Then review the model quarterly so it stays in line with longer-term plans.