Published on
August 15, 2026

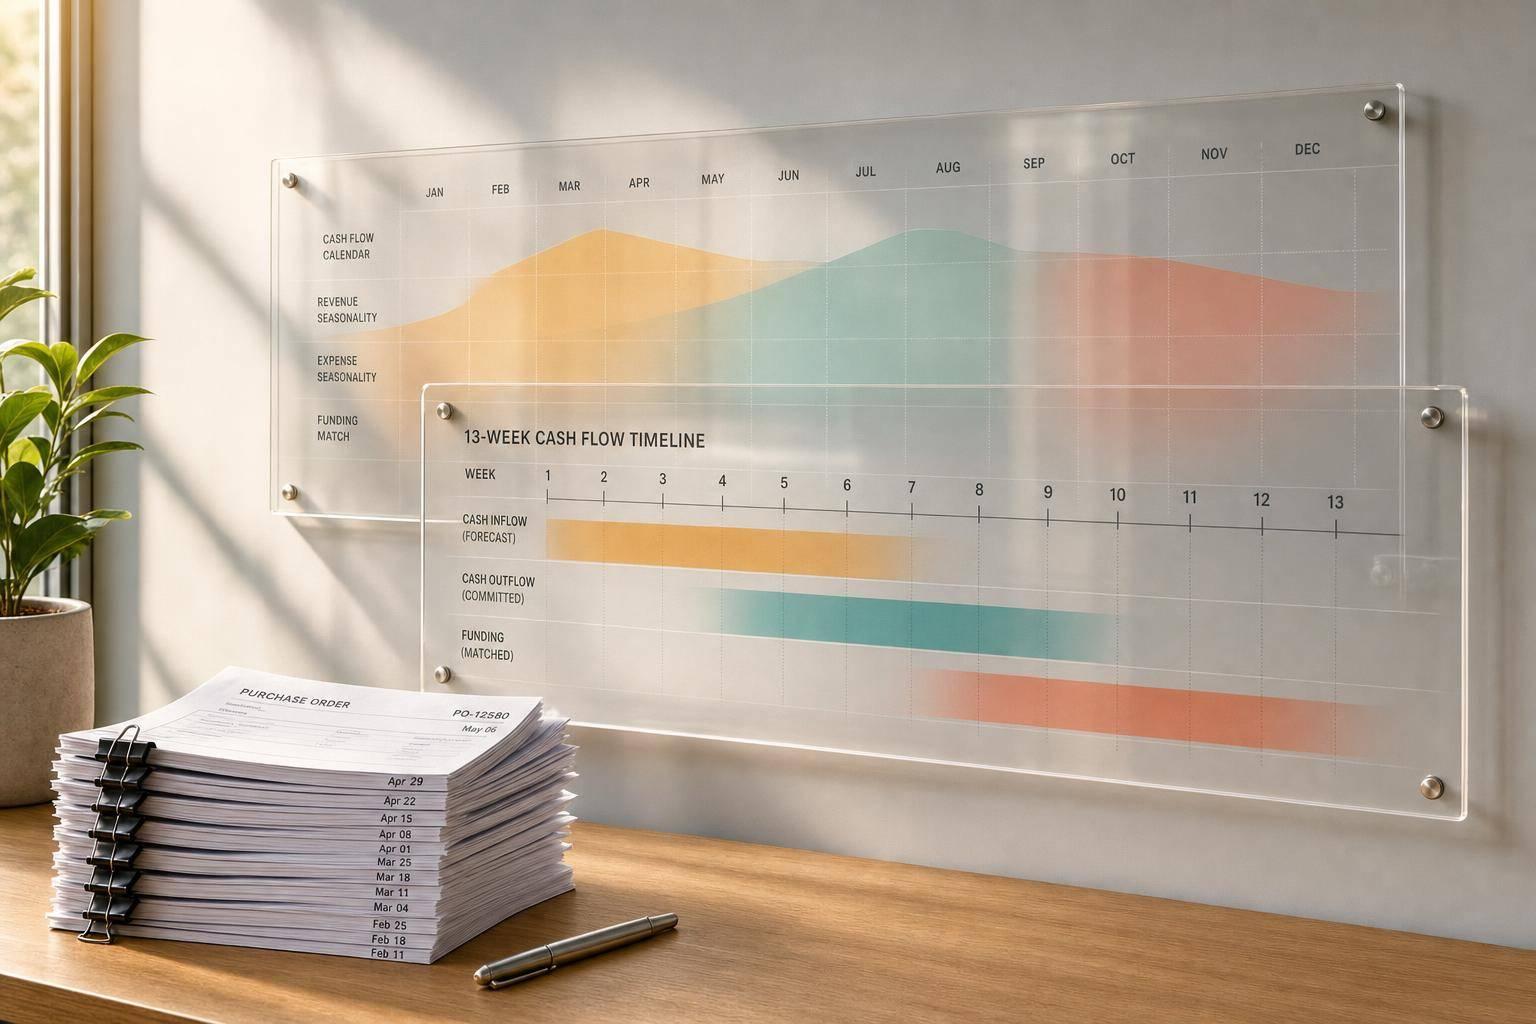
Profit can look fine while cash runs out. If your business buys inventory, ramps marketing, or adds staff before peak sales, your cash low point can hit weeks or months before revenue peaks.
Here’s the short version: I’d plan seasonal cash in four moves:
The article’s core point is simple: for growth firms in the $500,000 to $10,000,000 revenue range, seasonality can create cash strain even when sales are strong. That matters because about 82% of small business failures involve cash flow problems, and the median U.S. small business holds only about 27 days of cash buffer.
If I were boiling this down for a founder or finance lead, I’d focus on these questions:
A few ideas drive the full guide:
In short: I’d use a weekly cash view to find risk weeks, a monthly view to size the season, supplier terms to ease the gap, and a revolving facility or other short-term funding only for the part cash reserves can’t cover.
That’s the lens for the rest of the article.
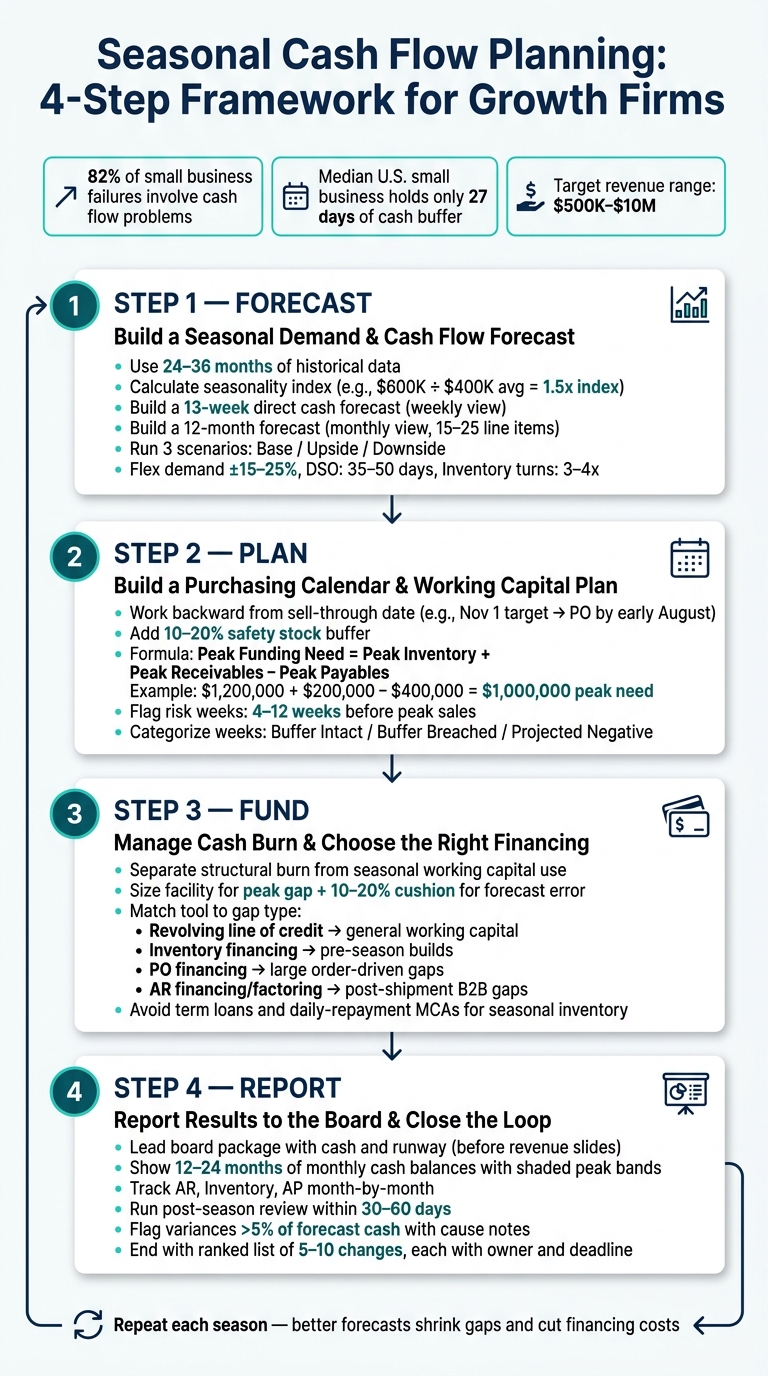
Seasonal Cash Flow Planning: 4-Step Framework for Growth Firms
Turn past seasonality into a forecast you can actually use for buying and funding decisions, often with the help of fractional CFO services.
Pull 24 to 36 months of monthly data into one sheet: revenue, units, margin, COGS, inventory, collections, AR, DSO, operating expenses, and one-offs. [1][10]
The point here isn't just to spot your busy months. It's to separate baseline demand from seasonal lift. Start with a 12-month moving average. Then divide each month's revenue by that average to get a seasonality index. If December revenue is $600,000 and the moving average is $400,000, the index is 1.5. That means demand ran 50% above trend. Use that index in the forward forecast. [2][5]
Tag each month by what drove it: holiday peak, back-to-school, off-season, or promotion-heavy. That simple step helps connect the spreadsheet to what was happening in the business.
One thing can throw the whole model off: one-off events. Strip out unusual spikes like pandemic-era demand or a single large enterprise contract before you calculate seasonal indexes. If you leave them in, future demand can look bigger than it is, and that can lead to a cash squeeze later.
Once you've got a clean seasonal pattern, map it into weekly and monthly cash timing.
Build two forecasts that work together: a 13-week direct cash forecast for near-term liquidity decisions and a 12-month forecast for medium-term planning. [2][3][4][9]
The 13-week forecast starts with your opening cash balance for the first week. Then layer in weekly cash inflows, like customer receipts and loan draws, and subtract weekly outflows: payroll on actual pay dates, rent on the first of the month, supplier payments tied to Net 30/60 terms, freight, taxes, and debt service. Each week's ending cash becomes the next week's opening balance. [4][6][11]
A simple example makes this click:
That weekly view makes pressure points hard to miss.
The 12-month forecast moves to monthly buckets, but the logic stays the same. Translate revenue into cash receipts using actual DSO, not invoice dates, because cash often shows up weeks after the sale. [2][7] In practice, a monthly model usually includes 15 to 25 line items such as customer receipts, inventory purchases, payroll, rent, marketing, freight, taxes, debt service, capex, and other operating costs.
Update the 13-week forecast weekly and the 12-month forecast monthly. Rolling both forward keeps your near-term and strategic views current. [2][3][4][9]
These forecasts should feed your purchasing calendar, working capital plan, and funding size.
Run three forecast versions before you lock in spend. The base case uses your most likely assumptions. The upside case assumes stronger sell-through, faster collections, and more efficient logistics. The downside case should model weaker demand, margin pressure, slower inventory turns, and higher freight costs. [3][8]
Keep the scenario inputs tight. Focus on the few drivers that move cash the most:
For example, you might flex demand by ±15% to ±25% versus base, use DSO of 40 days in base, 35 in upside, and 50 in downside, and model inventory turns of 4x per year in base and 3x in downside. [3][8]
Each scenario will give you a different borrowing peak and cash floor. That's the number set that should guide your inventory commitment and credit line size, not one single forecast.
Use the downside case to set peak working capital and borrowing needs in Step 2 and Step 3.
Use the downside case to set order timing and your minimum cash buffer. Then turn the forecast into an actual buying schedule.
Start with the date inventory needs to be on hand and ready to ship or sell. From there, subtract each step in the chain: production lead time, quality checks, packaging, freight transit, customs clearance if needed, receiving, and internal handling. That gets you to the purchase order release date.
Here’s a simple example. If your product must be available by November 1, your supplier needs 45 days to produce, ocean transit takes 30 days, and customs plus receiving takes 7 days, your PO needs to go out by early August. On top of that, add a 10–20% safety stock buffer to your forecast quantity to cover demand jumps and supplier delays, and build that into the order size.[14][15][16]
Pre-season inventory buys create the cash gap. Cash goes out 60–90 days before revenue comes back.[1] So timing matters just as much as order size. A large order placed a few weeks too early can put extra pressure on cash when you can least afford it.
Once you have the order date, map it week by week so you can see when funding pressure starts to build.
Use this formula:
Peak funding need = Peak inventory + Peak receivables − Peak payables
Here’s what that can look like in practice. A consumer goods brand may see inventory rise from $300,000 in early August to $1,200,000 by late October. Receivables might peak at $800,000 in December, while payables sit at $400,000 in October. The biggest funding strain shows up when inventory is high but cash from sales hasn’t fully arrived. In this case: $1,200,000 + $200,000 − $400,000 = $1,000,000 in peak funding need.[12][18][20]
Next, lay that number over your 13-week cash forecast and build a cash risk calendar. Flag any week where available cash, after subtracting your minimum operating buffer, drops below your floor. These risk weeks often show up 4–12 weeks before peak sales, which gives you a window to respond if you spot them soon enough.[12][13][17]
A simple way to sort them:
That makes it easier to see which weeks need supplier term changes, financing, or shifts in order timing.
Those risk weeks show you exactly where supplier terms or cash reserves need to fill the gap.
Once you know where the pressure points are, start with supplier agreements. That’s often the first and best place to find relief.
For example, moving payment terms from Net-30 to Net-60 on a $500,000 seasonal PO can push a full month of cash demand closer to the revenue period. That can shrink peak funding need by hundreds of thousands of dollars. Milestone-based payment structures can help too. A setup like 20% on PO issuance, 40% at production completion, and 40% on delivery lowers the early cash hit.[19][21]
Use the options below to reduce the cash gap without putting supply at risk:
| Strategy | Cash Impact | Stockout Risk | Key Trade-offs |
|---|---|---|---|
| Bulk pre-season buy | High upfront cash use | Lower if forecast is accurate | Higher carrying cost; more leftover inventory risk |
| Smaller, staggered POs | Smoothed cash outflow | Moderate if supplier timing is reliable | More admin work; possible higher freight or unit cost |
| Net-60 / Net-90 supplier terms | Improves short-term liquidity | Low if supply stays dependable | Requires supplier trust and negotiation |
| Milestone-based payments | Reduces early cash burden | Low to moderate | Stronger contracts and vendor alignment needed |
After you’ve tightened supplier terms, size whatever gap is left with a mix of cash reserves and a revolving credit facility. Tie draw triggers straight to your cash risk calendar - for instance, draw only when cash falls below your minimum operating buffer. That kind of control helps you avoid borrowing more than you need.[12][13][17]
Once you know the size of the cash gap, the next step is to separate true burn from seasonal timing before you borrow against it.
Structural burn means your recurring overhead is higher than your gross profit. Seasonal working capital use is different. That’s cash that gets tied up for a while in inventory, freight, and receivables.
Here’s the key idea: not every cash shortfall means the business is broken. Sometimes cash is just stuck in the cycle.
To make the split, look at 12 months of cash flow and remove the known seasonal swings in inventory, receivables, and payables. What’s left is your core monthly burn. If that number is still negative after you remove seasonal timing, the issue is structural, and working capital financing by itself won’t solve it. If it turns positive, you’re dealing with a timing gap, not a business model problem.
This matters a lot when you talk with lenders or your board. A company that makes money on a normalized basis, but gets squeezed by inventory timing, looks very different from one that stays cash-negative all year.
Size the facility for the peak cash gap, not the average month.
Your facility should cover the biggest forecasted working capital gap. That’s the roughest point in the cycle, when inventory is at its highest and customer payments haven’t come in yet. Add a 10% to 20% cushion for forecast error and slower collections.[25]
Then match the financing tool to the type of gap:
| Financing Tool | Best Use Case | Collateral | Repayment Flexibility | Seasonal Fit |
|---|---|---|---|---|
| Revolving line of credit | General working capital gaps | Varies | Draw and repay as needed | Strong |
| Inventory financing | Pre-season inventory builds | Inventory | Tied to inventory turnover | Strong |
| PO financing | Large orders, cash-constrained production | Purchase orders | Repaid when the order is fulfilled | Good for order-driven businesses |
| AR financing / factoring | Post-shipment collection gaps | Accounts receivable | Repaid as invoices collect | Strong for B2B with longer payment terms |
| Term loan | Long-lived assets | Asset being financed | Fixed schedule | Poor fit for seasonal working capital |
A simple way to think about it: if the gap rises and falls with the season, the financing should do the same.
Facility type is only half the choice. Repayment timing matters just as much.
Fixed monthly payments on a term loan don’t care that most of your revenue shows up during peak season. They still pull cash out during the slow months, which is often when you can least spare it.
The best seasonal facilities let you draw during the pre-season build and repay from peak-season cash flow. That match helps keep interest costs lower and avoids cash drain in the weakest part of the year. Agricultural lenders have worked this way for decades - crop loans are often set up so repayment comes shortly after harvest, when cash is on hand, instead of on a fixed schedule that ignores the production cycle.[22][23][24]
Also, stay away from merchant cash advances and other daily-payback products for seasonal inventory. Daily splits from card revenue can eat into cash at exactly the wrong time - when you should be building reserves for the next cycle.[26][27]
Once the season is funded, the next job is simple: show the board what cash actually did.
Put cash and runway first in the finance section, ahead of revenue or growth slides. That order matters because cash shapes every board-level decision that follows.[28][37]
Start with a one-page Seasonality & Cash Snapshot. Show 12 to 24 months of monthly cash balances as a trend line, and use shaded bands to mark repeat peak periods. Then label the moments that pushed cash up or down, like inventory builds, marketing pushes, and collection cycles.[34][37]
Under that, break out working capital by component month by month:
A stacked bar chart works well here. Add credit facility usage and headroom by month so the board can see, at a glance, whether the facility is sized well.
Then tie operating KPIs straight to cash results. Lead times, fill rates, and DSO all affect when cash comes in or goes out. Show how each KPI shifted cash timing, and add a short note beside each one to translate operating movement into dollar impact the board can follow.[33][35][36]
After the season ends, use the same dashboard to compare the plan with what happened and reset for the next cycle.
Run the post-season review within 30 to 60 days.[30][31] Focus on four areas: forecast accuracy, margin, collections and inventory, and financing cost and capacity. If any item misses by more than 5% of forecast cash, add a short cause note.[29]
Capture the review in a tight comparison table with plan versus actual for 10 to 15 key metrics, plus a variance column and a one-sentence comment for each line. This gives the board a clean way to discuss specific asks, such as resizing a credit line, shifting the purchasing calendar, or changing collection policies. Putting prior-year metrics next to current-year actuals also shows whether management is getting better cycle by cycle.
End the review with a ranked list of 5 to 10 changes for the next season. Give each change an owner and a deadline so follow-through is clear.
Seasonal cash control works best as a repeatable cycle, not a one-off fix. The firms that do this well run the same loop every time: forecast early, buy to the schedule, fund the peak, and report the result.[32][33][38]
Each trip through that loop builds on the last one. Better forecasts tighten the purchasing calendar, shrink peak cash gaps, cut financing costs, and give the board a cleaner basis for decision-making. That puts the next season on firmer ground than the one before it.
Aim to cover 3–6 months of operating expenses so you can handle lean stretches and sudden swings without scrambling. For growth-stage firms, a common rule of thumb is to keep at least 6 months of runway, plus an extra 15% cash buffer to deal with scaling bumps.
It also helps to set aside 10–15% of total cash for strategic flexibility. Phoenix Strategy Group can help model base and aggressive scenarios, set board-approved liquidity floors, and support debt covenant compliance.
A 13-week cash forecast gives you a week-by-week view of liquidity.
It should show:
The goal is simple: see your cash position before it becomes a problem.
Update the forecast every week and compare it with actual results. That makes it easier to spot timing shifts, adjust spending, and flag any week when cash gets close to your minimum reserve.
Review your Cash Conversion Cycle (CCC). If it keeps getting worse - for example, by 10–20 days across three straight periods - that can signal a structural problem, not just a short-term timing issue.
Seasonal problems tend to show up in patterns you can spot across 2–3 years of past data. A 13-week cash flow forecast helps you tell the difference between normal timing swings and deeper issues in collections, payables, and burn. If the gaps stick around after the usual seasonal high points pass, they’re likely structural.