Published on
September 3, 2026


_Global growth can tie up an extra _$250,000 to $1.2 million_ in working capital fast._* For me, that’s the main takeaway: if you expand across borders, cash timing changes just as much as costs.
Here’s the article in plain English: the best tools help me do four things well - cut cash tied up in inventory and payables, see true landed cost, lower border and freight risk, and feed changes into a 13-week cash forecast. The article’s nine picks cover planning, supplier payments, shipment tracking, customs, and treasury.
If I had to boil it down, I’d look at each tool through this lens:
The list includes:
What stood out to me is how each tool maps to a different cash problem. Some cut inventory by 10%–25%. Some reduce delays, premium freight, or detention fees. Others help with supplier liquidity, sanctions screening, or forecast accuracy. Put together, they give finance and supply chain teams one way to judge ROI in dollars, not just activity metrics.
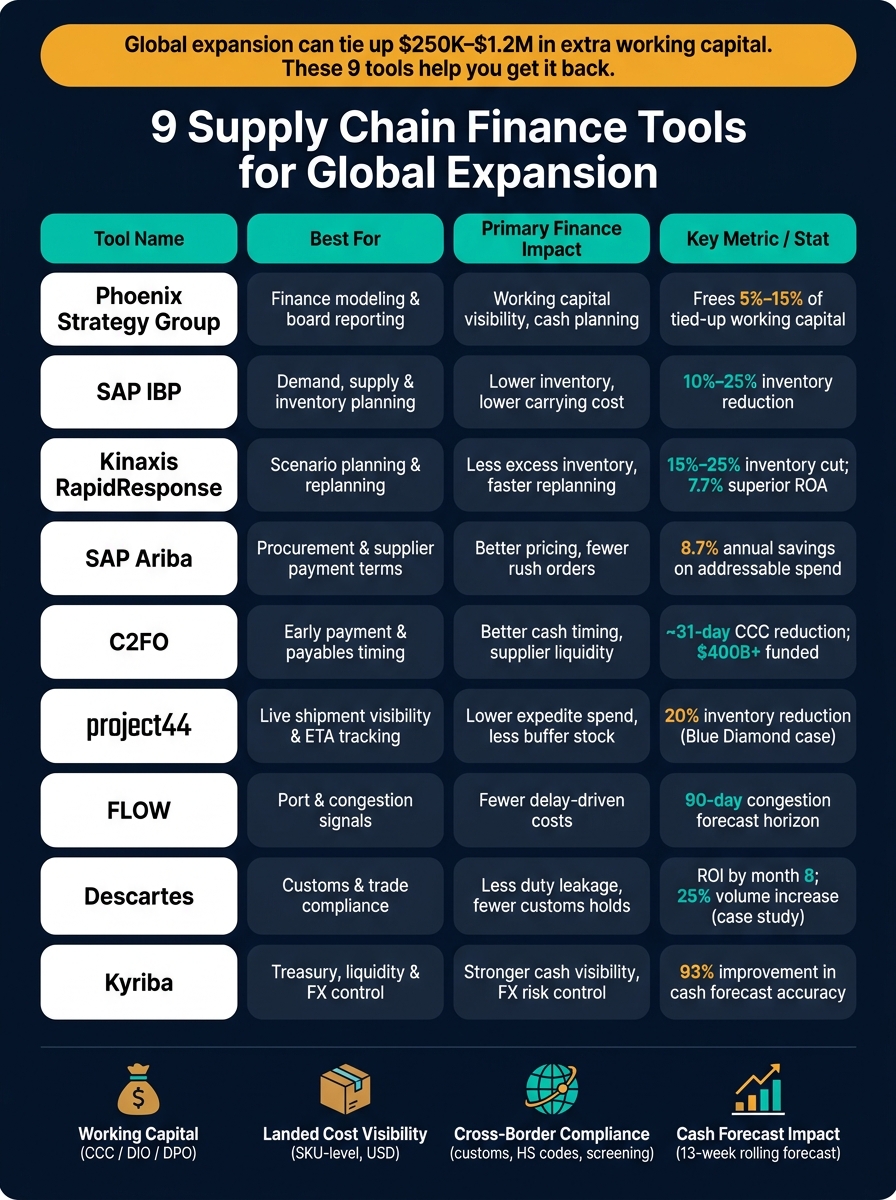
9 Supply Chain Finance Tools: ROI & Cash Impact Comparison
| Tool | Best for | Main money impact | Best fit |
|---|---|---|---|
| Phoenix Strategy Group | Finance modeling | Working capital visibility, cash planning | CFO, CEO, VP Finance |
| SAP IBP | Planning | Lower inventory, lower carrying cost | Supply chain leaders on SAP |
| Kinaxis RapidResponse | Scenario planning | Less excess inventory, faster replanning | Global supply chain teams |
| SAP Ariba | Procurement | Better supplier terms, spend control | Procurement leaders |
| C2FO | Early payment | Better cash timing, supplier liquidity | Treasury and finance |
| project44 | Shipment visibility | Lower expedite spend, less buffer stock | Logistics teams |
| FLOW | Congestion signals | Fewer delay-driven costs | Import and network teams |
| Descartes | Customs compliance | Fewer holds, lower duty leakage | Trade compliance teams |
| Kyriba | Treasury and FX | Better cash visibility, FX control | Treasury and corporate finance |
If I were reading this to make a short list, I’d start with one question: Where is cash getting stuck today - inventory, supplier terms, freight delays, customs, or treasury? That answer usually points to the right tool first.
Global sourcing changes when cash moves, not just what a company pays for goods. A supplier choice, order size, freight mode, or duty setup can shift both the amount and timing of cash flows. And that rolls straight into EBITDA, gross margin, cash conversion cycle (CCC), and return on invested capital (ROIC).
That’s where supply chain finance tools come in. They turn plant, supplier, and shipment data into a clearer view of landed cost, working capital, and ROIC. In practice, the first place you see the impact is usually sourcing and logistics.
A lower-cost offshore supplier can lift gross margin if quality stays steady and lead times don’t slip. But there’s a catch. Longer lead times and larger minimum order quantities often force companies to hold more inventory. That stretches DIO, lengthens the CCC, and ties up more cash in raw materials and work-in-process.
Logistics decisions can hit the income statement fast. A switch from ocean to air freight to fix a planning miss can wipe out the margin gain from lower-cost sourcing in one shipment. Duty exposure adds more pressure. Routing decisions change how much a company pays to bring goods into the U.S., and those costs go straight into COGS.
Tariff hedging can make things even tighter. When companies stockpile raw materials to get ahead of tariff shifts, inventory jumps, holding costs climb, and the risk of obsolescence goes up. Weak visibility into supplier lead times makes the problem worse because it often triggers emergency freight orders. Those surprise shipments drain cash, squeeze margin, and put more pressure on working capital.
That’s why leaders need a short list of finance metrics tied straight to supply chain execution.
During global expansion, the most useful metrics link supply chain activity to financial results.
These tools put those same metrics into dollar terms, so finance and operations can work from one scorecard - the same scorecard used to judge the nine tools that follow.
Not every supply chain tool helps you make better financial calls, a task often managed by fractional CFO services. Some help move goods. Fewer help you connect those moves to cash flow, margin, compliance, and ROI.
That difference matters a lot when your supply chain crosses borders and cash timing can shift fast.
Start with working capital. A useful tool should help shorten the cash conversion cycle, or CCC = DIO + DSO - DPO.
When CCC goes down, cash is freed up. That usually happens when the tool helps you cut DIO or extend DPO without putting pressure on suppliers. And this isn't just a nice metric on a dashboard. It has a direct dollar effect.
A 10-day CCC reduction on $50 million in annual COGS at a 5% cost of capital saves about $685,000 per year in financing costs [3][5][8][9].
That’s why it helps to look for tools that do more than report numbers. The better ones set a CCC baseline and show how moves like dynamic discounting or inventory optimization could change that number over a 12-month period.
Unit price alone doesn't tell you what an imported product costs.
Freight, duties, taxes, insurance, and handling all add up fast. If those costs aren't tracked well, they can wipe out 8%–15% of gross margin [6].
A strong tool should calculate landed cost at the SKU or shipment level in USD. It should also update those numbers when freight rates shift or duty classifications change. That way, you're not making pricing or sourcing calls with stale data.
Scenario modeling matters here too. For example, the tool should show the margin effect before you switch from ocean to air, move sourcing from Asia to Mexico, or change Incoterms. That kind of visibility can save you from an expensive surprise.
Once you can see landed cost, the next step is protecting that margin.
Cross-border trade comes with financial risk. Customs delays, denied-party violations, and misclassified HS codes can lead to direct cost exposure. This is where automation starts to pay off in a clear way: it can cut customs clearance time by up to 60% and lower trade costs by 5%–12% [7].
The tools worth your time should catch documentation gaps before a shipment moves. They should also screen against restricted party lists and help validate HS codes.
The best platforms go one step further. They turn disruptions like port congestion, geopolitical events, and carrier reliability issues into estimated USD cost and delay impact. That gives finance and ops teams something concrete to act on.
If a tool can't show its dollar impact, it's tough to defend in a boardroom.
The best tools connect KPI shifts - like freight savings, DIO reduction, and compliance incident rates - back to the 13-week cash forecast and the P&L. That means the platform needs to work with your ERP and treasury systems, not just display pretty charts.
A few things are worth checking:
Use these four tests to score each of the nine tools below.
| Factor | What to look for | Why it matters |
|---|---|---|
| Working capital impact | CCC modeling, DIO/DPO levers, dynamic discounting | Frees cash and cuts borrowing needs |
| Landed cost visibility | SKU-level cost breakdowns, duty and freight allocation, scenario modeling | Protects gross margin and pricing accuracy |
| Cross-border compliance | Customs workflows, HS code validation, restricted party screening | Cuts holds, penalties, and shipment delays |
| ROI measurability | KPI-to-dollar translation, 13-week cash forecast integration | Helps finance leaders prove value and rank rollout |
For teams that need hands-on financial modeling tied directly to supply chain choices, Phoenix Strategy Group offers advisory support that turns operating data into cash-impact analysis. The firm links supply chain decisions to cash flow through fractional CFO, FP&A, data engineering, and M&A advisory support.
Phoenix maps DPO, DSO, and inventory days by region and product line. Then it models supplier terms, dynamic discounting, and inventory rationalization in dollar terms. That matters because supply chain moves can look smart on paper and still put pressure on cash.
Their analysis often finds ways to free up 5%–15% of tied-up working capital in global operations [12]. Results feed into monthly dashboards and board packs, giving leadership a clear view of liquidity, borrowing needs, and interest expense.
Once the working-capital picture is in place, Phoenix builds landed-cost models to protect margin. These models include product cost, freight, duties, insurance, brokerage, compliance, and overhead, then convert the results to USD.
Scenario analysis shows margin impact before a sourcing, freight, or tariff change goes live. That gives teams a better read on the tradeoffs instead of learning the hard way after costs hit the P&L.
Phoenix tracks baseline DPO, DSO, inventory days, and financing costs over 6–12 months. It then links those changes to cash flow, EBITDA, and ROIC [10][11].
That kind of measurement holds up in board review, especially for companies getting ready for a funding round or exit. It also makes it simpler to compare advisory results with the planning and execution tools covered next.
SAP Integrated Business Planning (SAP IBP) connects demand, supply, inventory, and S&OP in one cloud platform. For companies expanding across countries, that link matters. It closes planning gaps that quietly eat up cash. Use IBP when planning choices need to flow straight into working capital, margin, and cash forecasts.
When cash is the focus, inventory is usually the biggest lever. SAP IBP's Inventory Optimization module uses real-time demand and supply signals to set precise safety stock and cycle stock targets across multi-echelon networks. It accounts for demand variability, forecast error, and supply uncertainty, so teams don't park cash in oversized buffers. [16][18][21]
The payoff can be direct. Implementations often reduce inventory by 10%–25%, which lowers DIO and frees cash. [17][22] Put that into plain dollars: a business carrying $50 million in inventory would free $7.5 million with a 15% reduction. [17][21]
SAP IBP also helps teams see the tradeoffs behind supply chain moves. Its scenario planning and what-if simulations let finance and supply chain teams test rerouting freight through different ports, changing supplier lead times, or adjusting service-level targets, then measure the effect on total supply chain cost. [13][15][22]
That means teams can compare a lower-priced supplier with longer lead times against a faster, higher-priced supplier with leaner stock and see which choice better protects margin once carrying costs and premium freight are added in. It's the kind of comparison that looks simple on paper but gets messy fast in practice. IBP makes that easier to sort through. When connected to ERP financials like SAP S/4HANA, those plans can also feed margin analysis and global pricing decisions. [13][15][22]
Cross-border operations bring more moving parts, and IBP gives planners a clearer view of that risk. It supports risk visibility through dashboards, external risk feeds, and disruption scenarios. Planners can import risk data such as category, duration, and severity for suppliers, transport lanes, and regions, then set alerts based on risk scores. [14][20][22]
With integration to platforms like Everstream Analytics, IBP can flag at-risk nodes and shipments and help teams test mitigation moves, including:
Its risk visualization and lead-time variability modeling also help teams identify lanes that may need extra inventory buffers or backup carriers before port delays or trade disruptions start hitting customer orders. [20][22]
For finance teams, one of IBP's strongest points is that operational metrics can be tied back to dollars. Teams can convert IBP's KPIs - inventory levels, service rates, and freight costs - into financial outcomes and place them into rolling cash forecasts. [13][17][19]
In practice, that means inventory, service, and freight changes can be translated into cash impact, with payback often falling in the 12–24 month range. [17][22] Teams can also model before-and-after cash forecasts to show how lower safety stock and fewer expedites improve monthly net cash and shorten the cash conversion cycle. [17][19] That kind of visibility is why IBP works best as a planning layer, not as a trade-compliance tool.
Kinaxis RapidResponse is a cloud planning platform that keeps demand, supply, inventory, capacity, and financial scenarios in one shared model. When one part of the plan changes, the rest updates fast. That matters when the biggest problem isn't just planning quality, but the cost of waiting to replan.
RapidResponse's main working-capital lever is inventory reduction. In many deployments, companies cut inventory by 15%–25% in the first year. Nikon, for example, cut finished goods inventory by 33%.[26][29] Planning cycles can also fall by about 35%.[26]
For finance teams, that's the part that tends to stand out first. Less inventory means less cash tied up on shelves, in warehouses, or in transit.
Inventory isn't the whole story. The same scenario data also lets teams test cost tradeoffs across shipping lanes and sourcing choices. RapidResponse does not calculate landed cost directly, but it does provide the inputs needed to model it.[23][24]
Here's the practical use case: switching a key lane from air freight to ocean freight may cut freight spend, but it can also increase safety stock needs. RapidResponse makes that tradeoff visible before the choice is locked in. Finance teams can then take those outputs, build landed-cost models by SKU or unit, and track gross margin by region.
RapidResponse supports cross-border risk with real-time visibility and disruption simulation, not trade compliance filing.[23][25] Teams can model supplier delays, port congestion, or regional capacity limits, then rebalance supply plans and see the effect on service levels and costs before the issue gets worse.[23][27]
This becomes far more useful when suppliers, ports, or carriers are spread across several countries. Kinaxis also partners with Exiger for multi-tier supplier risk assessment and Blume Global for transportation visibility. That connection pulls shipment data and updated ETAs into planning workflows.[30]
To keep it simple: RapidResponse handles planning. It does not handle customs filing or restricted-party screening.
For finance leaders, the payoff shows up in asset returns, lead times, and working-capital release that can actually be forecasted. A Kinaxis-cited analysis by Professor Swink found that companies using RapidResponse achieved a cumulative 7.7% superior Return on Assets (ROA) over three years versus peers. For a company with $10 billion in assets, that equals roughly $770 million in benefit.[28]
Nucleus Research estimates the platform cuts lead times for discrete manufacturers by around 20%, which supports higher revenue and better cash flow.[4] Finance teams can translate expected inventory reductions into changes in Days Inventory Outstanding (DIO), then feed those numbers into 13-week cash flow forecasts. That gives CFOs a much clearer view of when working capital is likely to open up and fund the next stage of expansion.[24][26]
SAP Ariba brings procurement, supplier management, and supply chain finance into one system. For manufacturers expanding into new markets, that matters. It helps teams control spend, support supplier liquidity, and manage cash timing with more precision. If expansion starts with supplier terms, tighter purchasing controls, and better cash planning, Ariba fits that job well.
The clearest working-capital lever in SAP Ariba is dynamic discounting and supplier financing. SAP Supplier Financing lets approved suppliers get paid early through integrated financing partners after invoice approval, while buyers can extend payment terms and hold onto cash longer.[34][37]
Ariba’s early-payment discount programs can also produce 18–36% annualized returns on early payments.[39] That gives finance teams a direct way to turn payables timing into a source of return instead of treating it as back-office admin.
Ariba captures PO and invoice data that finance teams can use to rebuild landed cost by shipment or SKU. From there, they can compare planned cost against actual cost across suppliers and shipping lanes. That makes it easier to spot margin leakage from surprise freight surcharges or duty changes before those issues become baked into the business.[31][35]
SAP Ariba Supplier Risk pulls external risk scores, certifications, and regulatory flags into one place. Teams can use it to screen suppliers, check documents, and maintain audit-ready records.[36][38]
It also uses AI-powered alerts to flag legal, labor, and geopolitical risk across the supplier base.[32][33][36] For companies expanding across borders, that kind of warning system can help prevent ugly surprises.
Top users achieve 8.7% annual savings on addressable spend, and case studies report ROI above 20% in the first year.[40][41] Those numbers make Ariba more than a procurement tool. It can have a direct finance impact.
Finance teams can also track invoice approval rates and early-payment usage to forecast cash outflows with more accuracy. Those patterns can then feed into weekly or monthly cash models in U.S. dollars.[1][34][37] If Ariba helps explain supplier-side cash movement, the next tools go deeper into shipment-level visibility, freight tracking, and transit risk.
C2FO is an on-demand working capital marketplace. It helps suppliers get paid early on approved invoices while buyers decide when cash goes out. As of December 2024, C2FO had passed $400 billion in lifetime funding and served more than 350,000 companies across 173 countries.[54] The big draw here is simple: more control over cash timing across large, global supplier networks.
C2FO uses supplier-set discount rates. That means suppliers can name their own rate for early payment instead of taking a fixed offer.[50][52] In practice, that can keep early-payment pricing competitive.
In many programs, C2FO cuts the cash conversion cycle by about 31 days.[49][53] That can matter a lot for U.S. buyers with overseas suppliers. When suppliers get cash sooner, they may be in a better spot to keep orders moving and avoid strain that can disrupt shipments.[42][44][45] If supplier liquidity has a direct effect on service levels or delivery continuity, C2FO tends to be a strong fit.
Invoice Central pulls invoices and expected payment dates into one place, which helps with short-term cash forecasting.[43] CFOs can watch a few core numbers closely:
Those figures can then feed into a 13-week cash forecast.[46][48] That’s useful because it turns early payment from a loose treasury tactic into something you can measure week by week.
There’s also the return side. A 2% discount paid 30 days early can beat many short-term cash equivalents.[44][47] C2FO also reports 0% credit loss on accelerated funding.[51] So the platform does a solid job of showing cash impact, even if it doesn’t track shipment-level trade controls.
C2FO supports global payment timing across more than 160 countries in 43 currencies.[55] That said, it does not manage customs, sanctions screening, or trade compliance.
So the line is pretty clear: C2FO is a cash tool, not a compliance tool.
For customs and regulatory control, the next tool fills that gap.
project44 gives teams real-time shipment visibility across truckload, LTL, air, and ocean. That kind of visibility helps companies cut buffer stock, premium freight, and forecast error. It now manages more than 1.5 billion shipments annually and has over 259,000 carrier connections.[62]
When a company expands into global markets, this becomes a money issue fast. A delayed shipment doesn't just arrive late. It can lead to extra inventory, higher freight spend, and less reliable cash forecasts.
This hits hardest when long international lanes push companies to hold more safety stock. project44's partnership with Celonis combines live shipment tracking with process analytics to improve working capital.[58]
Blue Diamond Growers used project44 with SAP Business Network for Logistics and reported:
Those numbers matter because inventory ties up cash. If a team can cut inventory without losing service levels, that cash can go somewhere else.
project44 helps teams spot delay-related cost drivers like detention, demurrage, rework, and premium freight. One customer saw a 99% reduction in detention and demurrage fees after using project44 visibility to prevent delays before those fees hit.[2]
That gives finance teams a much clearer view of landed cost. Instead of looking at one blended freight number, they can connect project44 data with ERP cost records and break cost per purchase order into parts such as base freight, accessorials, rework, and premium freight. That leads to sharper margin analysis, especially when product lines or lanes behave very differently.
The clearest ROI metrics here are pretty direct:
MasterBrand improved its on-time carrier completion rate from 58% to 93.6% in just two months after deploying project44.[59]
For finance teams, predictive ETAs create the most direct tie between logistics execution and the 13-week cash forecast. If inbound shipments are late, and teams know which ones are late and by how many days, they can adjust expected receipt dates in cash models, tighten accounts payable timing, and build cash scenarios based on late freight and lane-level volatility.[56][57]
Shipment visibility tells you what's late right now. FLOW tells you where the next traffic jam is forming.
FLOW is a DOT-led data-sharing platform that gives shippers a 90-day view of port and inland congestion. That gives teams time to adjust import plans before delays start squeezing cash flow.
Use FLOW to catch congestion early, then stagger purchase orders, shift bookings, and reduce emergency replenishment. The payoff should show up in DIO, cash-to-cash cycle time, and port-fee savings.
FLOW isn't a landed-cost tool. It's an early-warning signal.
Pipe its congestion data into landed-cost models so you can see surcharges, chassis scarcity, drayage, and storage costs coming before they eat into margin.[63][64][65]
FLOW covers congestion risk. It does not handle customs filing, duty calculation, or sanctions screening.[63][64][65]
Use FLOW as the risk layer. Then use customs software for filing, screening, and duty control.
The clearest ROI path is to treat FLOW as a planning input for tools you already use, such as SAP IBP, Kinaxis, or your TMS. That way, network-level congestion signals can feed straight into working capital decisions.[63][64][65]
Track avoided airfreight, lower carrying costs, and stronger OTIF. Then fold those gains into cash forecasts and lender updates.
That leads straight into the customs and regulatory compliance layer.
When shipment visibility stops, border work starts. Descartes brings customs and trade compliance into one place at the border, automating declarations, security filings, tariff classification, duty calculation, and denied-party screening across the U.S., Canada, the EU, the UK, the Middle East, and APAC. For manufacturers that source parts in one region, build in another, and sell across several markets, it swaps spreadsheet-heavy processes for one auditable workflow.
Border delays tie up both inventory and cash. Descartes helps cut that risk by standardizing documents, catching filing mistakes early, and supporting duty drawback, FTZ, and bonded warehouse workflows.
Descartes CustomsInfo and Global Trade Intelligence data connect with ERP and finance systems so teams can see duty, tariff, and preferential duty treatment data at the SKU and route level. That gives finance and operations a clearer view of landed cost and helps avoid margin surprises at customs.
The denied-party screening module keeps checking customers and transactions against global restricted-party lists. That matters because missed rescreening and outdated compliance checks have led to fines totaling $24,280,829.[66]
When clearance times improve, the payoff shows up in inventory timing and cash flow. G2 data puts average implementation at about 2 months, with ROI usually reached by the 8-month mark.[68] One customs brokerage customer reported a 25% increase in volume after implementation, along with 15% productivity gains and enough operating capacity to double bonded warehouse space from 25,000 sq ft to 50,000 sq ft.[67]
A practical way to measure the upside is to turn clearance-time gains into inventory timing shifts, then map those shifts to earlier availability of saleable goods and the cash conversion cycle.
Kyriba is a treasury platform built for cash forecasting, payments, FX exposure, and working capital. For global manufacturers, that matters a lot. As payment timing shifts from one region to another, companies need a clear view of liquidity. Once you expand across borders, supplier visibility alone isn't enough. Treasury visibility has to keep pace too.
Kyriba fits best when supplier terms, early-pay programs, and treasury liquidity need to sit under one control layer. Its supply chain finance programs let buyers extend DPO while still giving suppliers early payment at a lower financing cost.[71][75][77]
Here’s the plain-English version: a buyer gets more time to pay, while the supplier can still get cash sooner. That can ease pressure on both sides.
For example, extending average payment terms from 30 to 60 days on a $50 million annual spend can free several million dollars in working capital without squeezing suppliers.[75][77]
Kyriba’s cash forecasting brings together bank, ERP, and operations data in one platform.[69][72] That gives finance teams one place to track cash instead of piecing it together across systems.
It also helps leaders run real-time what-if scenarios. They can model how a shift in supplier payment terms or a move in production region may affect projected cash balances and short-term borrowing needs.[72][74] That kind of modeling is useful when margins are tight and timing changes can ripple through the business.
Cenveo achieved a 93% improvement in cash forecast accuracy and a 90% increase in productivity after adopting Kyriba's liquidity performance platform.[80] Kelkoo Group used Kyriba's enterprise liquidity management tools to gain consolidated cash visibility and improve forecasting control across its treasury operations.[79]
Better forecasting can also help cut borrowing costs and improve capital timing.
Cross-border growth brings more than shipping and supplier issues. It also adds currency swings and sanctions exposure. Kyriba supports sanctions screening, regulatory reporting, and hedge accounting.[78]
Its FX tools help teams hedge currency exposure before payment timing changes hit margins.[70][73][76] That matters when a payment delay in one market can turn into a margin problem in another.
That makes Kyriba a strong fit when cash forecasting and FX control need to move in step with the supply chain.
Once you’ve measured each tool on its own, pull everything into one shared ROI model. Global expansion works a lot better when planning, procurement, freight, customs, and treasury all report into the same financial scorecard. The aim isn’t more dashboards or more raw data. It’s one model that ties every tool back to cash, cost, and forecast accuracy.
Use the same KPI dictionary across every system: CCC, inventory turns, forecast accuracy, OTIF, expedite spend, landed cost variance, and working capital released.
Each tool should tie to at least one of three business outcomes:
Planning tools like SAP IBP and Kinaxis link to inventory turns and forecast accuracy. Procurement and supplier financing tools like SAP Ariba and C2FO connect to days payable outstanding (DPO) and cost per transaction. Visibility tools like project44 connect to expedite spend and OTIF. Customs tools like Descartes connect to duty leakage and landed cost variance. Treasury tools like Kyriba connect to cash forecast accuracy and liquidity gaps avoided.
Turn KPI changes into annual dollar impact. That means inventory reduction becomes cash released, freight reduction becomes avoided cost, and better forecasts become lower safety stock and fewer expedites.
For board reporting, split hard savings from cash release. That distinction matters. Cash release helps liquidity, even when it doesn’t show up as a direct drop in operating expense. AGCO cut freight costs by 18% in 18 months, then reduced inbound logistics costs by 28% and inventory by 25%.[83]
Feed shipment milestones, supplier payment terms, landed cost inputs, and scenario outputs into the rolling 13-week cash forecast. Then measure forecast improvement by comparing mean absolute percent error before and after adoption at the same forecast horizon.[81][82]
Phoenix Strategy Group can pull those outputs into one financial model for leadership review.
Use this same scorecard in the quick comparison table below.
After the ROI framework above, this table gives you a fast side-by-side view.
Use it to compare each tool by use case, finance impact, and owner.
| Tool | Primary Use Case | Primary Finance Impact | Best-Fit Owner |
|---|---|---|---|
| Phoenix Strategy Group | Financial modeling for global expansion | Better forecast accuracy and working-capital visibility | CEO, CFO, or VP Finance at a growth-stage manufacturer |
| SAP Integrated Business Planning | End-to-end supply chain planning across global networks | Lower inventory and lower carrying costs | VP or Director of Supply Chain running SAP ERP |
| Kinaxis RapidResponse | Concurrent planning and real-time scenario modeling | Faster planning response and less excess inventory | VP Global Supply Chain or S&OP leader at a multinational manufacturer |
| SAP Ariba | Procurement, supplier management, and procure-to-pay automation | Better pricing capture and fewer rush orders | Chief Procurement Officer or VP Sourcing with global supplier spend |
| C2FO | Early payment marketplace and working capital optimization | Better supplier liquidity and cash timing | Treasurer, CFO, or VP Finance with recurring supplier spend |
| project44 | Real-time multimodal transportation visibility and predictive ETA tracking | Less expedite spend and lower buffer inventory | Director of Global Logistics or VP Transportation at a U.S. importer |
| FLOW | Network-level port and freight visibility | Fewer congestion-driven delays and lower detention risk | Director of Logistics or network design analyst at a U.S. importer |
| Descartes Customs and Regulatory Compliance | Customs filing automation, tariff classification, and trade compliance | Less duty leakage and fewer customs holds | Director of Trade Compliance or Global Logistics Manager |
| Kyriba | Cloud-based treasury, liquidity management, and working capital optimization | Stronger cash visibility and FX risk control | Treasurer, CFO, or VP Corporate Finance managing multi-currency operations |
Figures are illustrative, not guaranteed.
Use this table to shortlist the tools that line up with your biggest cash constraint before the conclusion.
Global expansion works best when planning, sourcing, logistics, compliance, and treasury run as one cash system.
The thread running through all of it is cash. Lower inventory. Fewer delays. Cleaner compliance. Better forecast control. The payoff is straightforward: when teams measure operating gains in USD against cash conversion cycle, landed cost, and freight cost, leaders can see what matters first and decide where to put money next.
That’s where finance leadership carries the most weight. It turns operating data into decisions that lenders, investors, and boards can actually use. Phoenix Strategy Group can turn these outputs into board-ready FP&A, cash forecasts, and U.S. GAAP-aligned reporting for lenders and investors.
To turn these tools into ROI, start with one measurement framework. Audit where supplier terms, freight, duties, and FX exposure are tracked. Use one KPI scorecard. Convert the biggest gains into USD. Review it every quarter so ROI stays visible.
Start with the tool that fits your company’s growth stage and day-to-day complexity.
If you're running a smaller or early-stage business, simple connected tools usually make more sense. Basic forecasting features that sync with your accounting software can cut manual data entry and save a lot of time.
As the business grows, it makes sense to shift to more advanced ERP systems and automated spend analytics. That gives you real-time visibility, unified data, and predictive insights across the business.
The best setup combines the right tech with smart financial planning.
Measure ROI against a clear starting point. That means setting baselines first, then splitting savings into hard cost savings and soft cost savings so you can see what changed and where the impact came from.
Track metrics like DSO, DIO, DPO, inventory turnover, Purchase Price Variance, cost-to-sales ratio, cash flow forecasts, and unit economics. Those numbers give you a grounded view of performance, not just a rough guess.
Automated dashboards make this much easier. You can watch results in real time, run scenario models, and adjust budgets as conditions change instead of waiting for month-end reports.
And don’t look only at the sticker price. Include total cost of ownership, such as implementation and training, along with the initial purchase price.
Yes. Instead of waiting on slow monthly reports, these tools give teams real-time or near-real-time cash data. That means they can adjust forecasts, working capital, and payment plans much faster.
Phoenix Strategy Group points to faster insight and automation - like forecasting dashboards, automated invoice and AP workflows, and rolling 13-week forecasts - that can cut processing time from days to hours. Just as important, they can help teams spot cash shortages before they turn into bigger problems.