Published on
August 12, 2026


If I mix up utilization and capacity, I can misread hiring needs, revenue room, and cash timing. The short version is simple: utilization rate tells me how much of my team’s paid time is going to billable or productive work, while capacity rate tells me how much forecast demand my team can handle before it runs out of room.
Here’s the takeaway in plain English:
A few numbers make the difference clear:
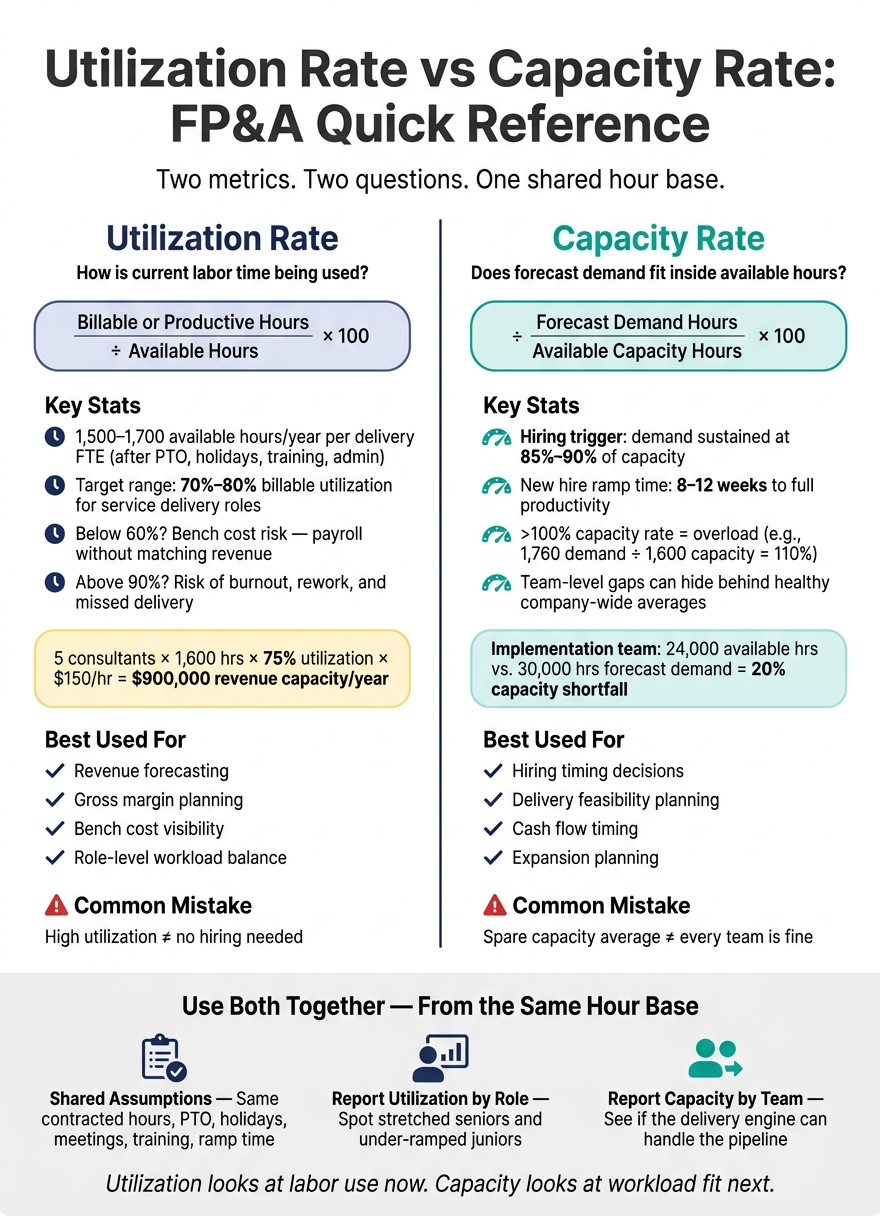
Utilization Rate vs Capacity Rate: FP&A Quick Reference Guide
| Metric | What it shows | Basic formula | Best use in FP&A | Common mistake |
|---|---|---|---|---|
| Utilization Rate | How current labor time is being used | Billable or productive hours ÷ available hours × 100 | Revenue, gross margin, bench cost | Thinking high utilization means no hiring is needed |
| Capacity Rate | How much forecast work fits into team hours | Forecast demand ÷ available capacity × 100 | Hiring timing, delivery load, cash timing | Thinking average spare room means every team is fine |
Put another way: utilization looks at labor use now; capacity looks at workload fit next. If I keep those roles separate, my forecast gets cleaner and my staffing calls get easier to time.
Utilization rate shows how much of your current labor time turns into revenue-producing work. It tells you how people’s time is being used. It does not tell you how much hiring room you have left. That’s why it works best as a forecast input, not a staffing cap.
Utilization Rate (%) = (Billable or Productive Hours ÷ Available Hours) × 100[3][6][7][11][14]
The big difference comes down to the denominator. Start with 2,080 annual work hours per FTE, then subtract PTO, holidays, training, and admin time. For delivery roles, available hours usually end up around 1,500 to 1,700 per year. Managers often come in lower.[11][13]
Billable utilization includes only hours you can bill to a client. Productive utilization is broader. It also includes internal work that still adds value, like scoping, proposals, R&D, or process improvement.[9] That’s why utilization sits inside revenue planning, not just ops reporting.
Most U.S. services businesses aim for 70% to 80% billable utilization for delivery roles.[8][9][4] Push that target too high, and there’s often not much room left for training, rework, or the normal ups and downs of client demand.
In a driver-based forecast, utilization connects straight to revenue:
Available Hours × Target Utilization × Average Billable Rate = Revenue Capacity[13][12][17]
Here’s a simple example. Say you have a team of five consultants. Each one has 1,600 available hours per year, a 75% billable utilization target, and an average rate of $150/hour.
1,600 × 0.75 × $150 = $180,000 per FTE per year
5 FTEs × $180,000 = $900,000 total annual revenue capacity[13][12][17]
Utilization also affects gross margin. When utilization goes up, gross margin tends to improve because fixed delivery labor gets spread across more revenue.[9]
When utilization drops, bench cost shows up fast - payroll with no matching revenue.[10][15][17] If a team is targeting 75% but actual utilization is sitting at 60%, that gap points to payroll cost being absorbed without the revenue to support it. Looking at that gap by role gives founders a clearer way to decide what to do next: push sales harder, move staff to other work, or build a planned bench into the cash-flow forecast.
Capacity rate tells you a simple but important thing: does forecast demand fit inside the labor time you actually have?
Capacity is the most work a team can take on during a set period. If demand goes past that limit, something has to give. You may need overtime, outside contractors, or you may miss deadlines. That’s why capacity rate is a stronger staffing signal than labor efficiency.
These terms sound close, but they’re not the same.
Capacity means realistic available hours after PTO, holidays, training, meetings, and admin time are taken out. Capacity rate measures forecast demand as a share of that capacity.
Capacity Rate (%) = Forecast Demand ÷ Available Capacity × 100
If demand is 1,760 hours and available capacity is 1,600 hours, the capacity rate is 110% - a clear overload signal.[19][24]
Put another way, utilization shows how labor is being used. Capacity rate shows how much room is left.
Once capacity is set, the fractional CFO or FP&A lead shifts their focus to timing: when will demand outgrow supply?
Teams usually compare forecast demand with available capacity by team, role, and month, not as one company-wide average. A top-line average can look fine while one team is already jammed.
A common hiring trigger shows up when forecast demand stays above 85% to 90% of capacity for several weeks or months. Why that range? Because new hires often need 8 to 12 weeks before they’re fully productive.[21][25] So a team can seem busy today, yet still have too little room for what’s coming next. That’s the gap capacity rate is meant to show.
Those capacity assumptions also feed straight into the financial forecast. Hiring earlier means payroll hits sooner, and contractor spend may show up sooner too.[20][22][23] That’s why capacity rate matters in staffing and cash planning, not only in operations reporting.
These two metrics answer different questions. Utilization rate asks: "How efficiently are we using the time we have?" Capacity rate asks: "Do we have enough time to deliver what's coming?" If you mix them up, hiring timing, revenue forecasts, and cash planning can get off track fast.
The table below shows the difference in formula, planning use, and forecast impact.
| Utilization Rate | Capacity Rate | |
|---|---|---|
| Definition | % of available hours spent on billable or productive work | % of available capacity required to meet forecast demand |
| Formula | Billable hours ÷ available working hours × 100 | Required demand hours ÷ available capacity hours × 100 |
| Scope | Individual, role, or project level | Team, department, or company level against forecast demand |
| Typical Use | Workload balance, pricing discipline, revenue per FTE | Hiring timing, delivery feasibility, expansion planning |
| Forecast Impact | Drives revenue and gross margin projections | Drives headcount, delivery risk, and cash management and flow timing |
| Risk if Misread | High utilization mistaken as growth readiness | Apparent spare capacity can still hide underestimation of demand |
Raw capacity is the input behind both metrics. By itself, it isn't a planning metric.
Use the metric that fits the question in front of you.
Utilization rate works best for near-term operating decisions. It helps you spot workload balance issues. Say a 10-consultant firm has seniors at 82% utilization and juniors at 58%. That points to a staffing mix problem, not a company-wide capacity issue. Role-level utilization makes that visible. Capacity rate alone would miss it [26][5][27]
Capacity rate is better for forward-looking planning. It tells you whether future demand will fit inside the hours you have. For example, if an implementation team has 24,000 available hours and forecast demand is 30,000 hours, capacity is short by 20% even if current utilization still looks healthy [26][5][27][1]
The most common mistake is simple: people see a busy team and assume there's still room.
Sustained utilization above 90% usually points to risk, not slack [26][5][28]
The opposite mistake happens too. Moderate utilization, like 60% to 65%, doesn't always mean the team is underperforming. Maybe the company hired ahead of demand on purpose. Maybe newer hires are still getting up to speed. Without comparing utilization to pipeline and capacity, it's hard to know whether you're looking at planned slack or plain overstaffing [28][1][18]
Keep the metrics separate in your model. Report utilization by role and capacity by team. A single company-wide average can blur both issues. Role-level utilization shows who is stretched and who has room. Team-level capacity rate shows whether the delivery engine can handle the pipeline [26][16][5][27][1][2]
Utilization rate shows how much paid time turns into productive work. Capacity rate shows how much work the team can still take on. In practice, that means use utilization for revenue and margin and use capacity for hiring and delivery timing.
The big thing is consistency. Build both metrics from the same hourly assumptions so the numbers don’t drift apart. Keep one shared assumption library that covers contracted hours, PTO, holidays, meetings, training, and new-hire ramp. Then use those same inputs in both utilization and capacity models so your forecasts stay in sync.
Use utilization in revenue and margin forecasts. Use capacity rate in headcount and delivery plans. That shared hour base matters a lot. If PTO policy changes or a hire starts later than planned, both models should update from the same source instead of forcing your team to patch numbers by hand.
Reporting level matters too. Report utilization by role and capacity by team. A company-wide average can hide what’s actually going on, like stretched seniors, under-ramped juniors, and bottlenecks starting to form.
Phoenix Strategy Group helps growth-stage companies build FP&A systems that connect utilization to unit economics and capacity to hiring and cash planning.
Yes. High utilization can look efficient on paper, but it often means the team is stretched too thin. That can limit growth and increase the risk of burnout.
When people are booked at maximum billable capacity all the time, delivery issues can start to show up too. A balanced target - usually 70% to 80% of working hours in professional services - gives teams room for admin work, training, and day-to-day communication.
Review capacity on a schedule that fits how your team works, from weekly to quarterly.
Quarterly resource audits help keep allocations lined up with company goals. Weekly or monthly reviews help you catch variances, spot bottlenecks or overtime spikes, and keep forecasts accurate as conditions change.
Both models need to use the same ground rules for available work hours, total resource pools, and the way they define active time versus idle time.
They also need to pull from the same clean, standardized data and use the same realistic view of non-billable time, including admin work and planned downtime. That way, capacity limits and labor usage are measured against the same day-to-day operating conditions.